Story Highlights
- Slight plurality of Americans in 2019 identified as conservative (37%)
- Moderates nearly as high, at 35%, while 24% were liberal
- Movement toward liberalism has slowed among Democrats, though still top group
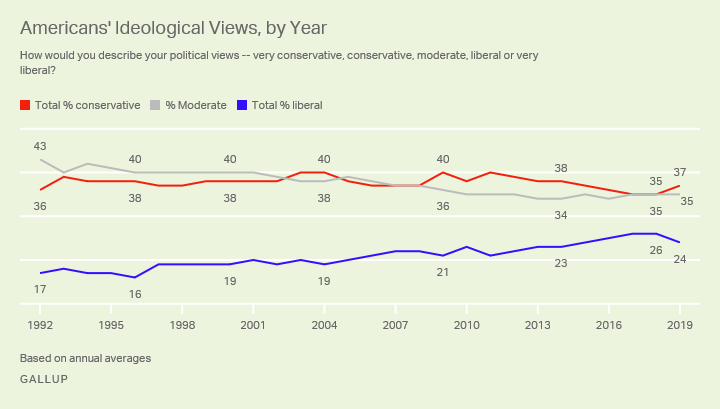
WASHINGTON, D.C. -- As Americans continued to lean more Democratic than Republican in their party preferences in 2019, the ideological balance of the country remained center-right, with 37% of Americans, on average, identifying as conservative during the year, 35% as moderate and 24% as liberal.
The 2019 findings are based on combined data from 21 Gallup telephone surveys conducted throughout the year, encompassing over 29,000 interviews with U.S. adults.
The percentage identifying as conservative in 2019 was up two points from the 35% measured in 2018, while the percentage liberal was down two points from 26%. While these changes are statistically significant, some two-point changes in the past were short-lived, so it will be important to see whether these trends continue in 2020.
Regardless, conservatives and moderates remain closely matched in U.S. ideological preferences, as they have been since 2015. This follows several years -- from 2009 to 2014 -- when conservatives consistently outnumbered moderates. Before that, from 1999 to 2008, the two groups were about even, whereas from 1992 to 1998, moderates generally had the slight edge.
Meanwhile, liberal identification has gradually expanded over the past two decades, rising from 16% in 1996 to 19% by the late 1990s, 20% during George W. Bush's presidency, an average 23% during Barack Obama's presidency and 25% since Donald Trump took office.
Republicans Remain a Mostly Conservative Party
While the country as a whole may be center-right, that is not the case for Republicans, who overwhelmingly identify as conservative.
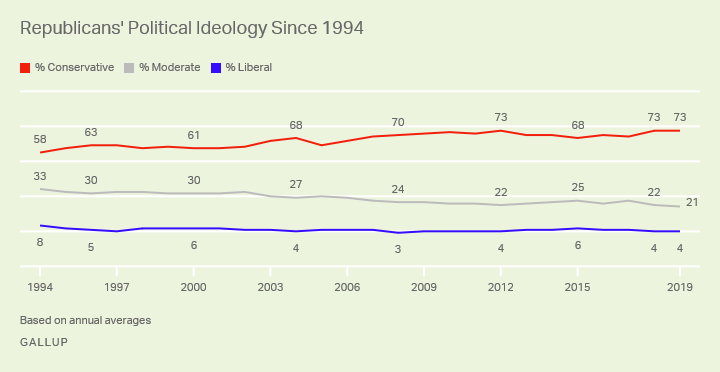
Conservativism averaged 73% among Republicans in 2019, maintaining the peak level recorded last year and previously in 2012. Most other Republicans, 21% of the party, identified as moderate, while 4% were self-identified liberals.
The large majority of Republicans have consistently labeled themselves conservative in Gallup polling over the life of this trend, although the proportion has inched up from about six in 10 during the early 1990s to over seven in 10 more recently. This shift may relate to the decrease in the percentage identifying as Republican over the same period and the corresponding increase in political independent identification. People who once might have been liberal or moderate Republicans may increasingly identify as politically independent instead.
Liberal Identification Levels Off Among Democrats
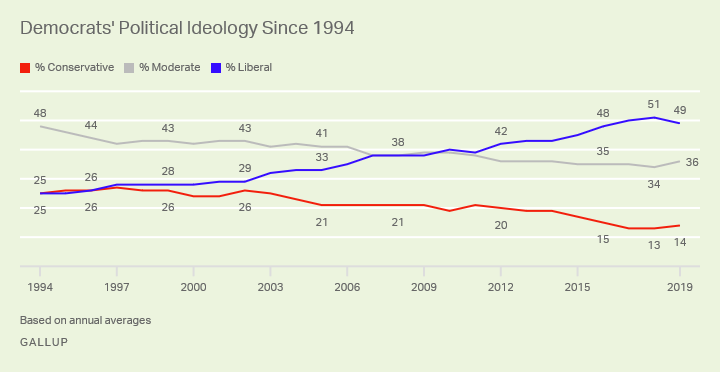
Democratic partisans are more ideologically diverse than Republicans, with 49% in 2019 identifying as liberal, 36% as moderate and 14% as conservative.
The liberal wing of the Democratic Party has about doubled in size over the past quarter century, rising from 25% in 1994 to 51% in 2018. The slip to 49% in 2019 suggests that trend may be slowing or leveling off, at least temporarily.
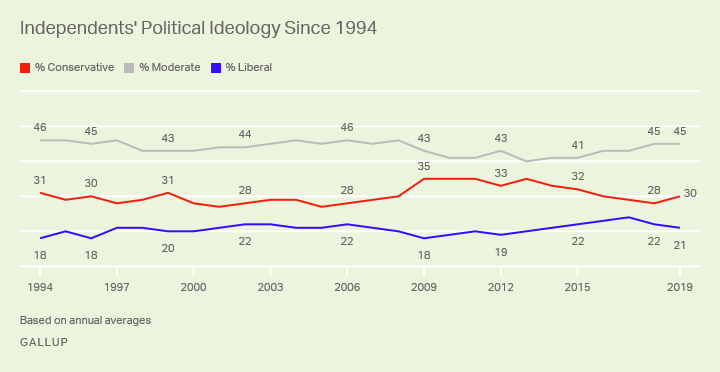
Moderates Outnumber Conservatives Among Independents
Independents typically mirror the country as a whole, but in this case they are more centrist than center-right. A large plurality identify as politically moderate (45%), whereas 30% call themselves conservatives, and only slightly fewer are liberal (21%).
Independents' political views in 2019 are nearly identical to those from 2018 and are generally in line with the long-term pattern, although conservatism was a bit higher among this group during the Obama years.
Ideology Also Differs by Most Demographic Groups
While partisanship is associated with the biggest differences in how Americans define their political views, significant differences are also seen among most subgroup categories. It should be noted that moderates are the largest segment among most groups, but there are important differences in the ideological balance at the margins.
-
Gender: Men lean decisively conservative, while women are more evenly divided.
-
Age: Conservatism is strongly correlated with age, rising from 26% of 18- to 29-year-olds to 46% of seniors. Liberalism moves in the opposite direction.
-
Education: Those with higher levels of formal education are less likely to be conservative and more likely to be liberal.
-
Race: Whites are more conservative than liberal, as are Hispanics to a lesser degree, while blacks lean liberal.
-
Geographic region: The coastal regions of the U.S. -- the East and the West -- are only marginally conservative in their ideological outlook, while the conservative advantage is stronger in the Midwest and South.
| Conservative | Moderate | Liberal | No opinion | Sample size | ||||||||||||||||||||||||||||||||||||||||||||||||||||||||||||||||||||||||||||||||||||||||||||||||
|---|---|---|---|---|---|---|---|---|---|---|---|---|---|---|---|---|---|---|---|---|---|---|---|---|---|---|---|---|---|---|---|---|---|---|---|---|---|---|---|---|---|---|---|---|---|---|---|---|---|---|---|---|---|---|---|---|---|---|---|---|---|---|---|---|---|---|---|---|---|---|---|---|---|---|---|---|---|---|---|---|---|---|---|---|---|---|---|---|---|---|---|---|---|---|---|---|---|---|---|---|
| % | % | % | % | n | ||||||||||||||||||||||||||||||||||||||||||||||||||||||||||||||||||||||||||||||||||||||||||||||||
| U.S. adults | 37 | 35 | 24 | 4 | 29,525 | |||||||||||||||||||||||||||||||||||||||||||||||||||||||||||||||||||||||||||||||||||||||||||||||
| Gender | ||||||||||||||||||||||||||||||||||||||||||||||||||||||||||||||||||||||||||||||||||||||||||||||||||||
| Men | 41 | 36 | 20 | 4 | 15,858 | |||||||||||||||||||||||||||||||||||||||||||||||||||||||||||||||||||||||||||||||||||||||||||||||
| Women | 33 | 35 | 28 | 4 | 13,667 | |||||||||||||||||||||||||||||||||||||||||||||||||||||||||||||||||||||||||||||||||||||||||||||||
| Age | ||||||||||||||||||||||||||||||||||||||||||||||||||||||||||||||||||||||||||||||||||||||||||||||||||||
| 18-29 | 26 | 40 | 30 | 4 | 3,969 | |||||||||||||||||||||||||||||||||||||||||||||||||||||||||||||||||||||||||||||||||||||||||||||||
| 30-49 | 34 | 37 | 26 | 4 | 7,203 | |||||||||||||||||||||||||||||||||||||||||||||||||||||||||||||||||||||||||||||||||||||||||||||||
| 50-64 | 42 | 34 | 21 | 3 | 7,714 | |||||||||||||||||||||||||||||||||||||||||||||||||||||||||||||||||||||||||||||||||||||||||||||||
| 65+ | 46 | 29 | 21 | 3 | 10,149 | |||||||||||||||||||||||||||||||||||||||||||||||||||||||||||||||||||||||||||||||||||||||||||||||
| Education | ||||||||||||||||||||||||||||||||||||||||||||||||||||||||||||||||||||||||||||||||||||||||||||||||||||
| Postgraduate | 26 | 36 | 36 | 2 | 5,948 | |||||||||||||||||||||||||||||||||||||||||||||||||||||||||||||||||||||||||||||||||||||||||||||||
| College graduate only | 32 | 38 | 28 | 2 | 6,958 | |||||||||||||||||||||||||||||||||||||||||||||||||||||||||||||||||||||||||||||||||||||||||||||||
| Some college | 38 | 37 | 22 | 3 | 9,994 | |||||||||||||||||||||||||||||||||||||||||||||||||||||||||||||||||||||||||||||||||||||||||||||||
| No college | 43 | 33 | 19 | 5 | 6,376 | |||||||||||||||||||||||||||||||||||||||||||||||||||||||||||||||||||||||||||||||||||||||||||||||
| Income | ||||||||||||||||||||||||||||||||||||||||||||||||||||||||||||||||||||||||||||||||||||||||||||||||||||
| $100,000 or more | 36 | 37 | 26 | 1 | 7,653 | |||||||||||||||||||||||||||||||||||||||||||||||||||||||||||||||||||||||||||||||||||||||||||||||
| $40,000-<$100,000 | 38 | 35 | 25 | 2 | 11,589 | |||||||||||||||||||||||||||||||||||||||||||||||||||||||||||||||||||||||||||||||||||||||||||||||
| Less than $40,000 | 36 | 36 | 24 | 3 | 7,475 | |||||||||||||||||||||||||||||||||||||||||||||||||||||||||||||||||||||||||||||||||||||||||||||||
| Race/Ethnicity | ||||||||||||||||||||||||||||||||||||||||||||||||||||||||||||||||||||||||||||||||||||||||||||||||||||
| Non-Hispanic white | 41 | 33 | 23 | 3 | 21,683 | |||||||||||||||||||||||||||||||||||||||||||||||||||||||||||||||||||||||||||||||||||||||||||||||
| Non-Hispanic black | 23 | 44 | 28 | 5 | 2,727 | |||||||||||||||||||||||||||||||||||||||||||||||||||||||||||||||||||||||||||||||||||||||||||||||
| Hispanic | 35 | 37 | 25 | 3 | 3,227 | |||||||||||||||||||||||||||||||||||||||||||||||||||||||||||||||||||||||||||||||||||||||||||||||
| Region | ||||||||||||||||||||||||||||||||||||||||||||||||||||||||||||||||||||||||||||||||||||||||||||||||||||
| East | 32 | 36 | 28 | 4 | 6,089 | |||||||||||||||||||||||||||||||||||||||||||||||||||||||||||||||||||||||||||||||||||||||||||||||
| Midwest | 38 | 35 | 23 | 3 | 6,238 | |||||||||||||||||||||||||||||||||||||||||||||||||||||||||||||||||||||||||||||||||||||||||||||||
| South | 41 | 35 | 21 | 4 | 10,303 | |||||||||||||||||||||||||||||||||||||||||||||||||||||||||||||||||||||||||||||||||||||||||||||||
| West | 34 | 36 | 27 | 3 | 6,895 | |||||||||||||||||||||||||||||||||||||||||||||||||||||||||||||||||||||||||||||||||||||||||||||||
| Party ID | ||||||||||||||||||||||||||||||||||||||||||||||||||||||||||||||||||||||||||||||||||||||||||||||||||||
| Republican | 73 | 21 | 4 | 2 | 8,998 | |||||||||||||||||||||||||||||||||||||||||||||||||||||||||||||||||||||||||||||||||||||||||||||||
| Independent | 30 | 45 | 21 | 4 | 11,544 | |||||||||||||||||||||||||||||||||||||||||||||||||||||||||||||||||||||||||||||||||||||||||||||||
| Democrat | 14 | 36 | 49 | 2 | 8,515 | |||||||||||||||||||||||||||||||||||||||||||||||||||||||||||||||||||||||||||||||||||||||||||||||
| Gallup, 2019 combined data | ||||||||||||||||||||||||||||||||||||||||||||||||||||||||||||||||||||||||||||||||||||||||||||||||||||
Bottom Line
Americans' influence on the course of U.S. politics and elections depends on two major aspects of their own political bearing: their support for the two major parties and their ideological perspective. If only one of these dimensions were a factor in voter attitudes and behavior, there would likely be little change in policies and leadership at the national level. With more Americans consistently identifying as Democratic, Democrats would consistently win the White House and prevail in Congress. Or absent partisanship, with Americans leaning center-right politically, the country would always elect a conservative Democrat or a liberal Republican president.
It's the combination of Americans' party and ideological preferences that injects variability into politics. Even within the parties there is dynamism, although perhaps less so among Republicans, given their general conformity around conservatism. But the Democratic Party is more fractured. And even though liberalism has been on the rise among Democrats, it is not yet the clear majority position, perhaps leading to the strong intraparty clashes seen over the past year on the Democratic debate stages and throughout social media, as Democrats try to come together around a standard-bearer for 2020.
Learn more about how the Gallup Poll Social Series works.