
Story Highlights
- 86% of Americans say they're "very" or "fairly happy," a new low
- Happiness reports down since 2008 among nonwhites, steady among whites
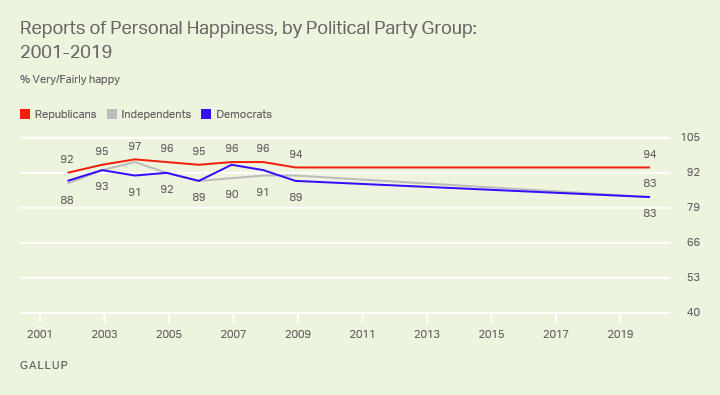
- Republicans' happiness still high, while Democrats', independents' slides
WASHINGTON, D.C. -- The vast majority of Americans report being "very" (42%) or "fairly happy" (44%), but the combined 86% is down from 91% the last time Gallup asked about this, in December 2008. It is also the lowest overall percentage happy Gallup has recorded in periodic readings over 71 years and is only the fifth time happiness has dipped below the 90% mark in 23 readings since 1948.
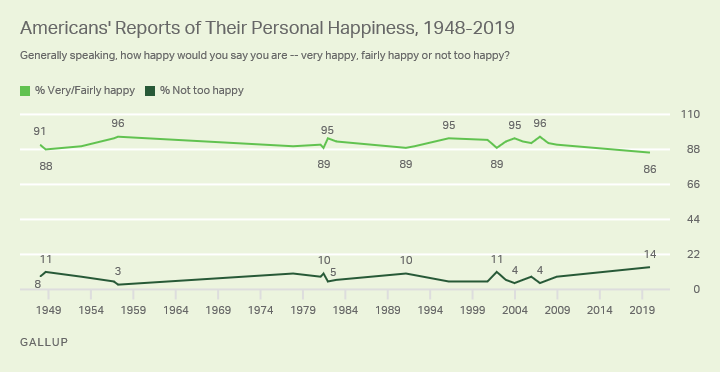
With fewer than nine in 10 Americans feeling happy in the Dec. 2-15 Gallup poll, one in seven (14%) are "not too happy," the highest measured to date.
Americans' subdued level of happiness at the end of 2019 fits in with Gallup research finding that Americans' levels of stress and worry reached new heights in 2018, while their self-reported anger matched the previous high. From a global perspective, the incidence of stress in the U.S. was among the highest in the world. And the U.N.'s annual World Happiness Report, which uses Gallup life satisfaction ratings, ranked the U.S. at No. 19 for happiness in the world last year -- down from No. 18 in 2018 and from No. 14 in 2017.
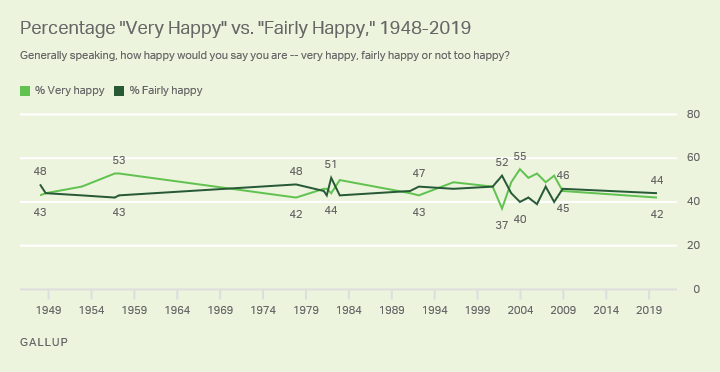
Currently, 42% of U.S. adults describe themselves as "very happy" and 44% as "fairly happy." Historically, however, slightly more Americans on average have reported being very happy (47%) than fairly happy (45%). The record for Americans saying they are very happy, 55%, was set in December 2003, a figure that may have been influenced by Iraqi dictator Saddam Hussein's capture, which occurred during the polling period.
Who Has Become Less Happy?
Gallup trends since 2001 show that happiness was largely similar among racial, education and party subgroups from 2001 to 2008, with a few minor differences noted below. However, more significant gaps are seen in the latest data, as some groups are as happy today as they were in 2008, while others are less likely to say they are happy:
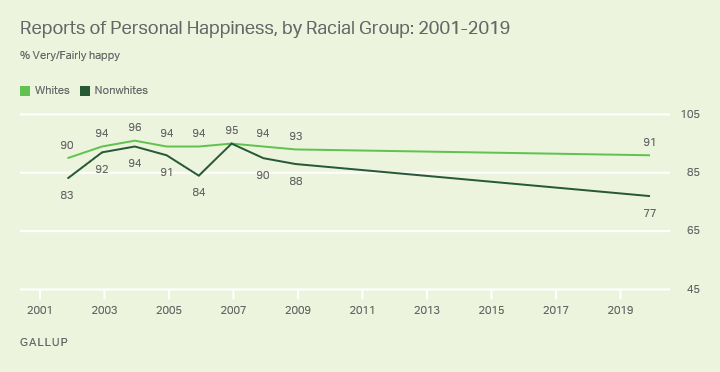
- Nonwhites: U.S. whites were a bit more likely to report being happy than nonwhites from 2001 to 2008. The difference was particularly acute in 2005, when 10 percentage points separated the two racial groups. That year, Hurricane Katrina ravaged the largely black city of New Orleans, Louisiana, and many black Americans interpreted the federal government's delayed response as rooted in racism. But the racial gap has widened to 14 points in the latest poll. The 91% of whites who report being happy in 2019 is within the 90% to 96% range seen since 2001, while nonwhites' reports of happiness have sunk to a new low of 77%.
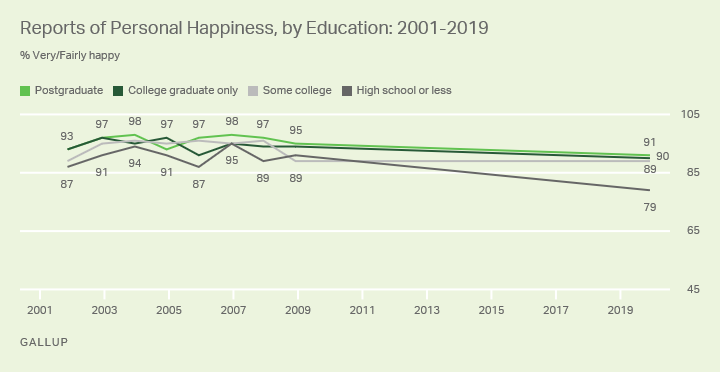
- Adults with no college education: Since 2001, adults with at least some college education have tended to be slightly happier than those without any college experience, but that is especially pronounced in the latest data. While most educational groups are a bit less happy than they were in 2008, happiness is down 12 points to 79% among those with no college education versus only a few points among those with a college degree or postgraduate education. There was no change among those with some college.
-
Democrats and political independents: Democrats and independents were slightly less likely than Republicans to report being happy in Gallup measures from 2001 to 2008, but the gap is much wider today. The 94% of Republicans who now report being happy is squarely within this group's previous range of 92% to 97%, while happiness has dropped from 89% in 2008 to 83% in 2019 among Democrats, and from 91% to 83% among independents. When one looks specifically at the percentage who report being very happy, the gap has widened between Republicans and Democrats. The current 53% of Republicans and 29% of Democrats who report being very happy marks a 24-point spread -- larger than the previous gaps of 5 to 21 points between 2001 and 2008.
Bottom Line
The vast majority of Americans report being happy today, but the level is slightly diminished in comparison to Gallup's historical trends since 1948.
The latest dip in U.S. happiness is likely intertwined with Americans' higher reports of stress, worry and anger. While stress, in particular, is not unique to the U.S., the country stands out on the list of mostly less developed countries where this emotion is most prevalent, as these countries face obstacles and instabilities on levels that Americans have not experienced.
View complete question responses and trends.
Learn more about how the Gallup Poll Social Series works.