
Story Highlights
- 41% of Americans are satisfied with the way things are going
- Satisfaction was last 40% or higher in July 2005
- 72% of Republicans are satisfied
WASHINGTON, D.C. -- Forty-one percent of Americans are satisfied with the way things are going in the U.S., a level not seen in nearly 15 years.
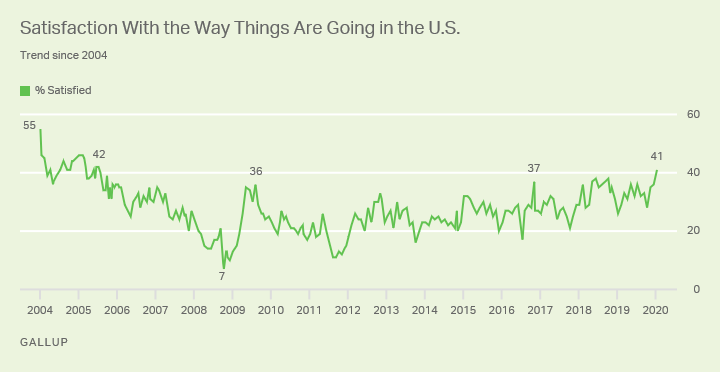
The last time 40% or more of Americans were satisfied, George W. Bush was in the first year of his second term as president. The Iraq War was ongoing, but some of the challenging events that plagued Bush in his second term -- Hurricane Katrina, consistent majority opposition to the Iraq War, high gas prices and the economic recession -- had yet to occur.
The higher level of satisfaction measured in the Jan. 2-15 Gallup poll comes at a time when Americans' evaluations of the U.S. economy are the best they have been in nearly two decades, perhaps because of continued low unemployment and record stock values.
Heightened Republican Satisfaction Pushes Number Higher
Americans are typically more satisfied with the state of the nation when their political party affiliation matches that of the sitting president. Consistent with this pattern, 72% of Republicans are currently satisfied with the way things are going in the U.S., compared with 14% of Democrats. Thirty-seven percent of independents are satisfied.
The five-percentage-point increase in overall satisfaction this month is primarily attributable to higher ratings among Republicans. Since last month, there has been a 14-point increase in Republicans' satisfaction. Meanwhile, the percentage of independents who are satisfied is unchanged since December, and Democrats show a statistically nonsignificant two-point increase.
Current Satisfaction Reading Slightly Above the Historical Average
Since Gallup began measuring national satisfaction in 1979, 37% of Americans, on average, have been satisfied, meaning the current figure is just above the historical average. The highest satisfaction level Gallup has measured was 71% in February 1999.
The prolonged slump in satisfaction ratings since 2005 -- with an average 27% satisfied -- has brought the historical average down six points from where it stood in 2004.
One reason satisfaction readings have been lower in recent years is that those who identify with the party that does not occupy the White House have been extremely reluctant to say they are satisfied with how things are going in the country. Since 2005, on average, 11% of the opposition party's supporters have said they were satisfied. Between 1992 (the earliest year for which Gallup compiled party data) and 2004, the opposition party's satisfaction levels were three times higher, at 34%.
However, reflecting a broader discontent that has taken hold in the country, supporters of the sitting president's party have also expressed lower satisfaction since 2005 (45%) than they did before (57%).
View complete question responses and trends.
Learn more about public opinion metrics that matter for the 2020 presidential election at Gallup's 2020 Presidential Election Center.