Story Highlights
- Concerns about COVID-19 testing and hospital capacity steadily declining
- About half of Americans still worried about hospitals and COVID-19 tests
- Young, nonwhite and nonrural respondents most likely to worry
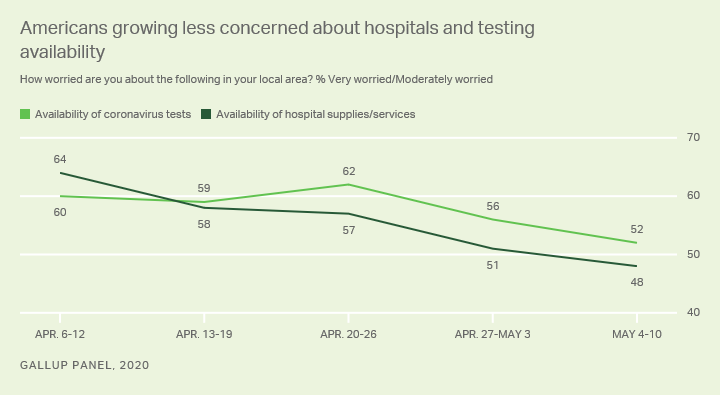
WASHINGTON, D.C. -- Substantially fewer Americans are worried now than two weeks ago about the availability of coronavirus tests as well as hospital supplies and services. The percentage worried about each has declined roughly 10 points since the week of April 20, and now about half of Americans worry about each issue.

In early April, Americans were briefly more concerned about the availability of hospital supplies and services than coronavirus tests. Since then, the U.S. public has grown less worried about the capacity of healthcare facilities and concern about the availability of tests has remained slightly, though consistently, higher than that for healthcare capacity. The percentage of the public who are very or moderately worried about testing availability has declined 10 percentage points in the past two weeks.
These changes likely reflect the expansion of coronavirus testing in the U.S. in recent weeks, as well as the closure of temporary hospital facilities and reduced crowding in places like New York and Detroit.
Younger, Nonwhite and Nonrural Americans Worry Most
Americans' current levels of concern vary widely across demographic groups, especially by area of residence, race and age.
| April 6-12 | May 4-10 | Change | ||||||||||||||||||||||||||||||||||||||||||||||||||||||||||||||||||||||||||||||||||||||||||||||||||
|---|---|---|---|---|---|---|---|---|---|---|---|---|---|---|---|---|---|---|---|---|---|---|---|---|---|---|---|---|---|---|---|---|---|---|---|---|---|---|---|---|---|---|---|---|---|---|---|---|---|---|---|---|---|---|---|---|---|---|---|---|---|---|---|---|---|---|---|---|---|---|---|---|---|---|---|---|---|---|---|---|---|---|---|---|---|---|---|---|---|---|---|---|---|---|---|---|---|---|---|---|
| % | % | pct. pts. | ||||||||||||||||||||||||||||||||||||||||||||||||||||||||||||||||||||||||||||||||||||||||||||||||||
| Gender | ||||||||||||||||||||||||||||||||||||||||||||||||||||||||||||||||||||||||||||||||||||||||||||||||||||
| Men | 55 | 49 | -6 | |||||||||||||||||||||||||||||||||||||||||||||||||||||||||||||||||||||||||||||||||||||||||||||||||
| Women | 66 | 56 | -10 | |||||||||||||||||||||||||||||||||||||||||||||||||||||||||||||||||||||||||||||||||||||||||||||||||
| Age | ||||||||||||||||||||||||||||||||||||||||||||||||||||||||||||||||||||||||||||||||||||||||||||||||||||
| 18-29 | 74 | 63 | -11 | |||||||||||||||||||||||||||||||||||||||||||||||||||||||||||||||||||||||||||||||||||||||||||||||||
| 30-49 | 65 | 58 | -7 | |||||||||||||||||||||||||||||||||||||||||||||||||||||||||||||||||||||||||||||||||||||||||||||||||
| 50-64 | 49 | 42 | -7 | |||||||||||||||||||||||||||||||||||||||||||||||||||||||||||||||||||||||||||||||||||||||||||||||||
| 65+ | 59 | 50 | -9 | |||||||||||||||||||||||||||||||||||||||||||||||||||||||||||||||||||||||||||||||||||||||||||||||||
| Race | ||||||||||||||||||||||||||||||||||||||||||||||||||||||||||||||||||||||||||||||||||||||||||||||||||||
| Nonwhite | 66 | 64 | -2 | |||||||||||||||||||||||||||||||||||||||||||||||||||||||||||||||||||||||||||||||||||||||||||||||||
| White | 59 | 48 | -11 | |||||||||||||||||||||||||||||||||||||||||||||||||||||||||||||||||||||||||||||||||||||||||||||||||
| Place of residence | ||||||||||||||||||||||||||||||||||||||||||||||||||||||||||||||||||||||||||||||||||||||||||||||||||||
| City | 71 | 65 | -6 | |||||||||||||||||||||||||||||||||||||||||||||||||||||||||||||||||||||||||||||||||||||||||||||||||
| Suburb | 61 | 57 | -4 | |||||||||||||||||||||||||||||||||||||||||||||||||||||||||||||||||||||||||||||||||||||||||||||||||
| Small town/Rural area | 54 | 42 | -12 | |||||||||||||||||||||||||||||||||||||||||||||||||||||||||||||||||||||||||||||||||||||||||||||||||
| Party identification | ||||||||||||||||||||||||||||||||||||||||||||||||||||||||||||||||||||||||||||||||||||||||||||||||||||
| Democrats | 84 | 78 | -6 | |||||||||||||||||||||||||||||||||||||||||||||||||||||||||||||||||||||||||||||||||||||||||||||||||
| Independents | 60 | 52 | -8 | |||||||||||||||||||||||||||||||||||||||||||||||||||||||||||||||||||||||||||||||||||||||||||||||||
| Republicans | 30 | 22 | -8 | |||||||||||||||||||||||||||||||||||||||||||||||||||||||||||||||||||||||||||||||||||||||||||||||||
| Gallup Panel, 2020 | ||||||||||||||||||||||||||||||||||||||||||||||||||||||||||||||||||||||||||||||||||||||||||||||||||||
Nonwhite respondents are 16 percentage points more likely than their white counterparts to be concerned about the availability of coronavirus testing. Moreover, while white Americans are 11 points less worried than they were one month ago, concern among nonwhite Americans has been essentially flat, shifting only two points over that period. This reflects Center for Disease Control data that suggest the coronavirus has disproportionately affected racial and ethnic minorities.
Additionally, those living in cities and suburbs are 15 to 23 points more likely to harbor these concerns than those living in small towns and rural areas, perhaps owing to higher rates of exposure in densely populated cities. Urban and suburban respondents have also been less encouraged by recent expansions in testing: while rural Americans are 12 points less concerned with the availability of tests than they were on April 12, those in suburbs and cities are now four and six points less worried than they were at that time, respectively.
The gap based on where Americans live widens when respondents are asked about concerns around hospital capacity. Urban and suburban Americans are more worried about this issue than rural Americans by 24 and 17 points, respectively.
| April 6-12 | May 4-10 | Change | ||||||||||||||||||||||||||||||||||||||||||||||||||||||||||||||||||||||||||||||||||||||||||||||||||
|---|---|---|---|---|---|---|---|---|---|---|---|---|---|---|---|---|---|---|---|---|---|---|---|---|---|---|---|---|---|---|---|---|---|---|---|---|---|---|---|---|---|---|---|---|---|---|---|---|---|---|---|---|---|---|---|---|---|---|---|---|---|---|---|---|---|---|---|---|---|---|---|---|---|---|---|---|---|---|---|---|---|---|---|---|---|---|---|---|---|---|---|---|---|---|---|---|---|---|---|---|
| % | % | pct. pts. | ||||||||||||||||||||||||||||||||||||||||||||||||||||||||||||||||||||||||||||||||||||||||||||||||||
| Gender | ||||||||||||||||||||||||||||||||||||||||||||||||||||||||||||||||||||||||||||||||||||||||||||||||||||
| Male | 57 | 43 | -14 | |||||||||||||||||||||||||||||||||||||||||||||||||||||||||||||||||||||||||||||||||||||||||||||||||
| Female | 70 | 52 | -18 | |||||||||||||||||||||||||||||||||||||||||||||||||||||||||||||||||||||||||||||||||||||||||||||||||
| Age | ||||||||||||||||||||||||||||||||||||||||||||||||||||||||||||||||||||||||||||||||||||||||||||||||||||
| 18-29 | 83 | 68 | -15 | |||||||||||||||||||||||||||||||||||||||||||||||||||||||||||||||||||||||||||||||||||||||||||||||||
| 30-49 | 71 | 52 | -19 | |||||||||||||||||||||||||||||||||||||||||||||||||||||||||||||||||||||||||||||||||||||||||||||||||
| 50-64 | 55 | 39 | -16 | |||||||||||||||||||||||||||||||||||||||||||||||||||||||||||||||||||||||||||||||||||||||||||||||||
| 65+ | 54 | 42 | -12 | |||||||||||||||||||||||||||||||||||||||||||||||||||||||||||||||||||||||||||||||||||||||||||||||||
| Race | ||||||||||||||||||||||||||||||||||||||||||||||||||||||||||||||||||||||||||||||||||||||||||||||||||||
| Nonwhite | 72 | 56 | -16 | |||||||||||||||||||||||||||||||||||||||||||||||||||||||||||||||||||||||||||||||||||||||||||||||||
| White | 60 | 45 | -15 | |||||||||||||||||||||||||||||||||||||||||||||||||||||||||||||||||||||||||||||||||||||||||||||||||
| Place of residence | ||||||||||||||||||||||||||||||||||||||||||||||||||||||||||||||||||||||||||||||||||||||||||||||||||||
| City | 72 | 61 | -11 | |||||||||||||||||||||||||||||||||||||||||||||||||||||||||||||||||||||||||||||||||||||||||||||||||
| Suburb | 67 | 54 | -13 | |||||||||||||||||||||||||||||||||||||||||||||||||||||||||||||||||||||||||||||||||||||||||||||||||
| Small town/Rural area | 56 | 37 | -19 | |||||||||||||||||||||||||||||||||||||||||||||||||||||||||||||||||||||||||||||||||||||||||||||||||
| Party identification | ||||||||||||||||||||||||||||||||||||||||||||||||||||||||||||||||||||||||||||||||||||||||||||||||||||
| Democrat | 84 | 70 | -14 | |||||||||||||||||||||||||||||||||||||||||||||||||||||||||||||||||||||||||||||||||||||||||||||||||
| Independent | 65 | 50 | -15 | |||||||||||||||||||||||||||||||||||||||||||||||||||||||||||||||||||||||||||||||||||||||||||||||||
| Republican | 37 | 19 | -18 | |||||||||||||||||||||||||||||||||||||||||||||||||||||||||||||||||||||||||||||||||||||||||||||||||
| Gallup Panel, 2020 | ||||||||||||||||||||||||||||||||||||||||||||||||||||||||||||||||||||||||||||||||||||||||||||||||||||
Despite evidence from the CDC that older adults are more susceptible to coronavirus, Americans under the age of 50 are more likely to be concerned about testing and hospital services than those 50 and older. However, the age group at the highest risk -- those over 65 years old -- is slightly more worried than those between the ages of 50 and 64, and that level of worry has declined less in the last month than it has for those under 50.
Political affiliation may explain at least some of the demographic differences in the level of concern across age, race and region. Though all partisan groups have become less worried about hospitals and testing availability since early April -- at a roughly equal pace -- Democrats are more concerned than Republicans by a margin of more than 50 percentage points. While independents are more than 20 percentage points less concerned than Democrats about hospitals or testing, they are still more than twice as likely as Republicans to say they are worried.
Learn more about how the Gallup Panel works.


