Story Highlights
- 48% say U.S. coronavirus situation is getting worse, up 11 points in one week
- 39% say they "always" social distance, steady for past three weeks
- Record-high 36% think disruption will last rest of year; 28%, longer still
WASHINGTON, D.C. -- In early June, as states were continuing to ease restrictions meant to curb the spread of the coronavirus in the U.S., increasing numbers of Americans began to loosen their social distancing behaviors. Yet, in the past two weeks, as reported cases of the virus have risen sharply in some areas of the country, Americans' perceptions of the coronavirus situation in the U.S. have worsened, and self-reported social distancing, which had been declining, has plateaued.
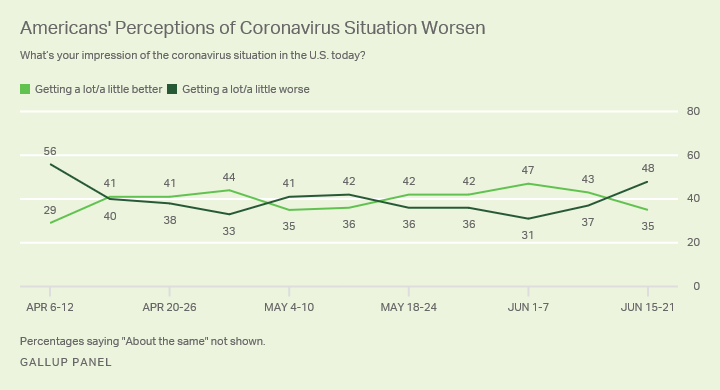
From mid-May to mid-June, more Americans said the U.S. COVID-19 situation was getting better than getting worse, but the latest polling, conducted June 15-21, finds an 11-point increase in the percentage who think the situation is deteriorating. As a result, 48% of U.S. adults now say the situation is worsening "a lot" or "a little," while 35% say it is improving "a lot" or "a little" and 17% think it is staying the same.

Line graph. Americans' impressions of the coronavirus situation in the U.S. since April 6, 2020. Currently, 48% say it is getting a lot or a little worse, and 35% say it is getting a lot or a little better. Those who say it is about the same are not shown. The latest readings mark an 11-point increase in the percentage saying it is getting worse.
Gallup began tracking this measure in its probability-based online survey in early April, as coronavirus cases in the U.S. were still rising sharply. The latest reading, which comes as COVID-19 cases are on the rise in many Southern and Western states, is the worst since the initial April 6-12 measure, when 56% of Americans said the situation was getting worse.
Partisanship strongly colors views of many aspects of the pandemic, including its trajectory, as Democrats are more than three times as likely as Republicans to say it is getting worse, 75% vs. 20%. For their part, 45% of independents say the same.
Social Distancing, Isolation Level Off
Since Gallup first asked Americans about their social distancing behaviors in mid-March, majorities have said they distanced "very often" or "always" in "the past 24 hours." From late March to early May, majorities consistently said they had always socially distanced the previous day.
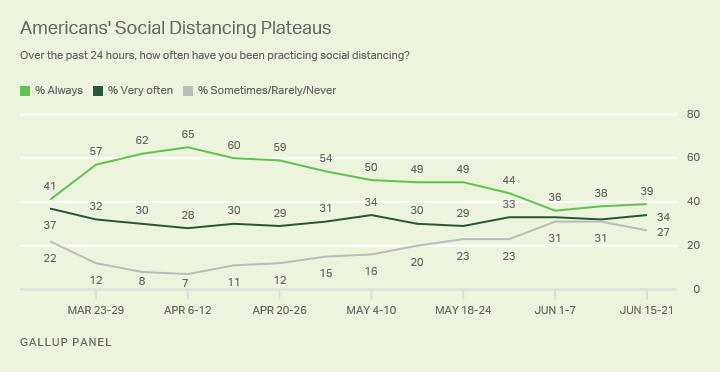
But as state economies began to reopen, reports of social distancing trended downward. In the first week of June, 36% of U.S. adults said they had socially distanced all the time and 33% very often, marking an eight-point decrease from the previous week. Distancing behaviors have not changed appreciably since then, as 39% currently say they are always and 34% very often doing so. Fewer say they are sometimes (15%), rarely (6%) or never (6%) socially distancing.

Line graph. Americans' social distancing practices since March. Currently, 39% say they always socially distanced over the previous 24 hours; 34% say they did this very often; and 27% say they sometimes, rarely, or never did. Frequency of social distancing declined in early June but has held steady since then.
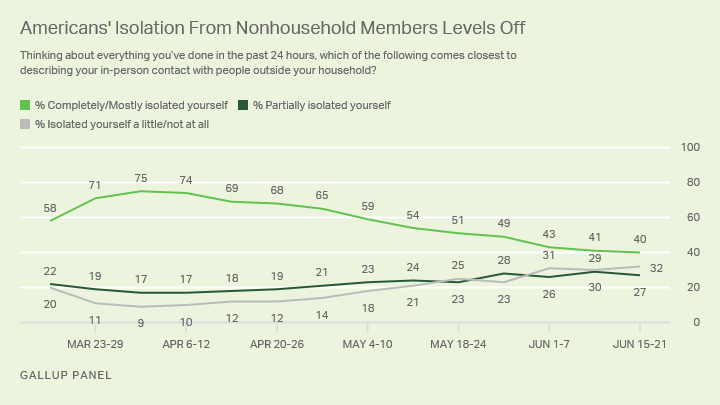
Americans' reports of their in-person contact with people outside of their households have evolved similarly to their social distancing behaviors. For the past three weeks, roughly equal percentages (about four in 10) say they completely or mostly isolated themselves from nonhousehold members during the previous day. Another 27% of U.S. adults now say they were partially isolated, and 32% -- up from 9% in early April -- say they were isolated a little or not at all.

Line graph. Americans' descriptions of their contact with people outside their households since mid-March. Currently, 40% completely or mostly isolated, 27% partially isolated, and 32% isolated a little or not at all. Isolation (completely/mostly) peaked in early April at 75%.
Record High Think COVID-19 Disruption Will Last Through This Year or Longer
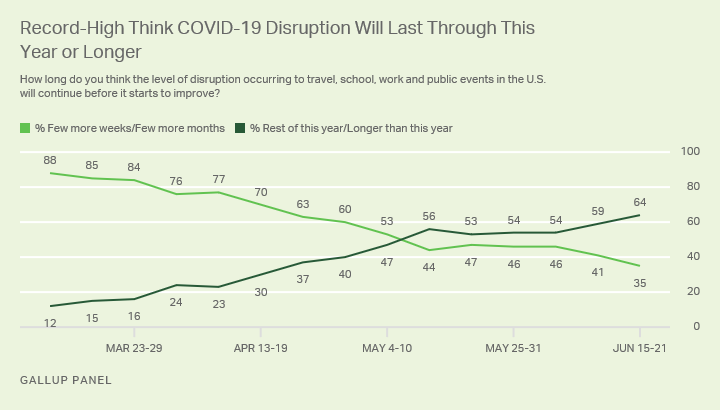
As the pandemic has worn on, Americans' outlook for the duration of the associated disruption has evolved. Currently, 36% think the disruption will continue for the rest of the year, 28% expect it to continue longer than that, and just over one-third say it will last only a few more months (23%) or weeks (12%).
This marks a sharp reversal from the beginning of the pandemic, when at least three-quarters of U.S. adults expected the disruption from the virus to improve within a few months at most.

Line graph. Americans' expectations for how long the disruption occurring to travel, school, work and public events in the U.S. will continue. Currently, 64% say it will last the rest of the year or longer, and 35% say it will be a few more weeks or months. This is a sharp reversal from mid-March, when 88% expected it to last a few more weeks or months, and 12% said it would last the rest of this year or longer.
Partisans have vastly different outlooks: Democrats (83%) are much more likely than Republicans (43%) and independents (64%) to expect the interruption to last at least the rest of the year.
Most Say Staying Home Is Best; Face Mask Usage Remains High
As social distancing and isolating have leveled off after recent declines, so too has Americans' belief that it is better for people who do not have symptoms of the coronavirus and are otherwise healthy to stay home as much as possible, rather than leading their normal lives. Currently, 66% of U.S. adults believe this to be the case, down from a high of 91% in late March but unchanged since late May.
When they do go outside their homes, 83% of Americans say they have worn a mask. This reading is unchanged since early May, but a sizable gap in partisans' mask usage remains. Currently, 97% of Democrats, 71% of Republicans and 79% of independents say they have worn a mask outside their home in the past seven days.
Learn more about how the Gallup Panel works.


