Story Highlights
- Conservatives and moderates remain largest ideological groups
- Liberals constitute smaller share, at 25%
- Ideological conformity of the parties holds steady at high levels
WASHINGTON, D.C. -- Americans' overall ideological views were about the same in 2020 as in 2019, with 36%, on average, identifying as conservative, 35% as moderate and 25% as liberal.
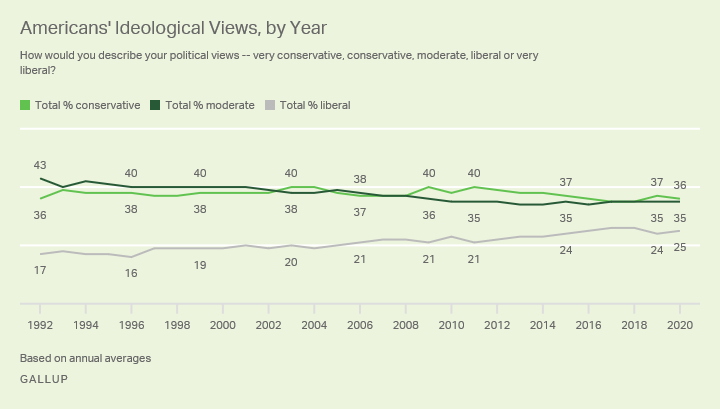
Line graph. Annual trend from 1992 to 2020 in Americans' overall ideological views. The percentage conservative has been fairly steady in the mid-30s and was 36% in 2020. The percentage moderate has declined over time, falling from 43% in 1992 to 35% in recent years, including in 2020. The percentage liberal has slowly increased, from 17% in 1992 to 26% in 2017 and 2018; it was 25% in 2020.
These results differ from Gallup's midyear report in June, which showed that conservative identification was waning. After reaching an unusually high 40% in January and February, the percentage "conservative" fell to 34% in May and June. However, it subsequently rose to 36% in the second half of the year, resulting in the average 36% identifying as conservative for 2020 as a whole.
The 2020 results are based on combined data from 18 separate Gallup polls conducted between January and December, encompassing interviews with more than 18,000 U.S. adults.
The 11-percentage-point lead for conservatives over liberals in 2020 is on par with Americans' ideological leanings between 2014 and 2019, when the lead averaged 12 points. Conservatives' edge had been in the mid- to high teens for the few years before that and had averaged 20 points from 1992 to 2005.
The shrinking conservative advantage in American politics over the past quarter-century is owing mainly to a decrease in the percentage of people identifying as moderate -- from 43% in 1992 to 35% today. This has been accompanied by an increase in liberal identification, from 17% to 25%. The percentage calling themselves conservative has been steadier over time and, at 36%, is the same today as in 1992.
Partisan Ideological Leanings Unchanged
Although Americans as a whole are a mix of ideological viewpoints, the two major political parties have become increasingly polarized over the years in their tenor.
The 51% of Democrats identifying as liberal matches the prior high from 2018, but it has been near this high-water mark for the past five years. The next-largest group of Democrats are ideological moderates, at 35%, followed by conservatives, at 12%.
While the conservative share of the Democratic Party is not insignificant, it has shrunk by more than half over the past quarter-century, falling 13 points since 1994. Moderates have seen similar shrinkage, down 13 points, while the percentage liberal has about doubled.
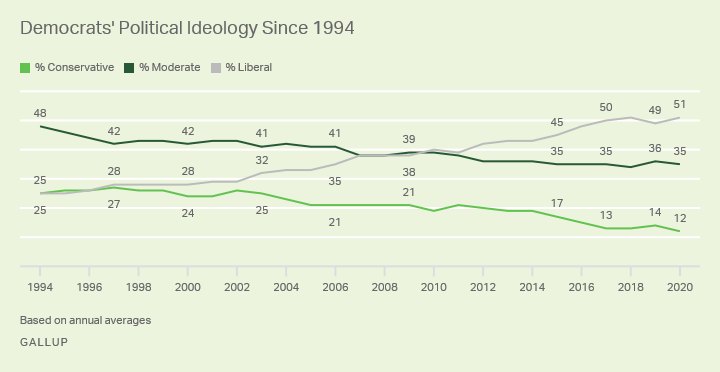
Line graph. Annual trend from 1994 to 2020 in Democrats' ideology, with 51% in 2020 identifying as liberal, 35% as moderate and 12% as conservative. This marks a sharp change since 1994, when 48% were moderate, 25% liberal and 25% conservative.
Ideological uniformity is much higher among Republicans, 75% of whom now consider themselves conservative, up slightly from 73% in 2019 and the highest proportion yet in Gallup's trend since 1994.
Meanwhile, one in five Republicans describe their views as moderate, down from 33% in 1994, while just 4% say they are liberal, similar to most years.
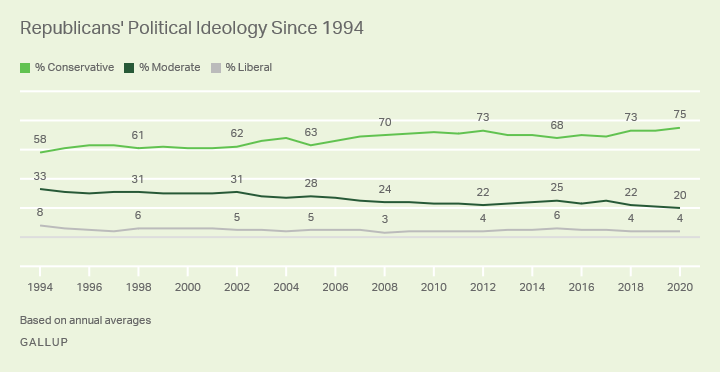
Line graph. Annual trend from 1994 to 2020 in Republicans' ideological views, with 75% in 2020 identifying as conservative, 20% as moderate and 4% as liberal. A smaller majority of 58% were conservative in 1994, while most of the rest, 33%, were moderate and relatively few then, as now, were liberal (8%).
The plurality of independents continue to identify as ideologically moderate (48%), as they have throughout Gallup's trend, while the rest are closely split between conservatives (29%) and liberals (20%). Independents' views have shifted relatively little over the years.
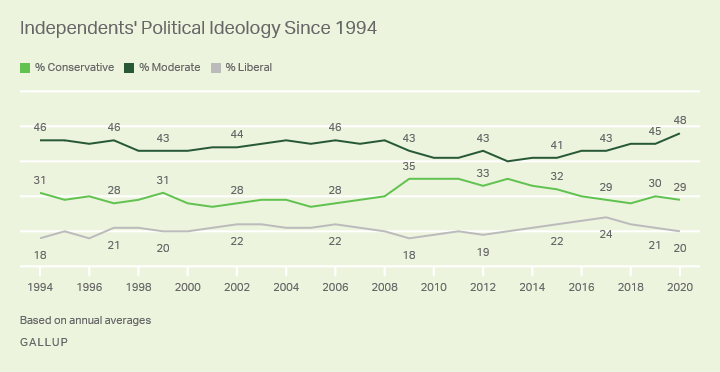
Line graph. Annual trend from 1994 to 2020 in independents' ideological views, with 48% in 2020 identifying as moderate, 29% as conservative and 20% as liberal. This is consistent with the broad pattern since 1994.
Bottom Line
President-elect Joe Biden takes office at a time when the two major political parties have been closely matched, with 30% identifying as Democrats on average in 2020, 29% as Republicans and 39% as independents. Only when factoring in independents' leanings do Democrats enjoy a true edge over Republicans in national support, 48% to 43%.
But party ID doesn't tell the full story on the nation's political will, as there are ideological crosscurrents. While most Republicans identify as conservative, a quarter hold moderate or liberal views. And Democrats exhibit even more heterogeneity, with close to half identifying as moderate or conservative and the slight majority identifying as liberal.
Independents, meanwhile, are predominantly moderate in their ideological views, which is where leaders seeking bipartisan support or hoping to unite the country may need to pitch their policy proposals.
Learn more about how the Gallup Poll Social Series works.