Story Highlights
- 60% of U.S. adults drink alcoholic beverages, down from 65% in 2019
- Americans' average weekly number of drinks dips to 3.6 from 4.0
- Beer consumed most often (39%), followed by wine (31%) and liquor (27%)
WASHINGTON, D.C. -- Sixty percent of U.S. adults currently report drinking alcoholic beverages such as liquor, wine or beer, marking a decrease from 65% in 2019 when the measure was last tracked. This puts current alcohol consumption on the low end of the range Gallup has recorded over the past two decades, with the percentage imbibing as high as 67% in 2010.

Line graph. Percentage of Americans who say they use alcoholic beverages such as liquor, wine or beer, since 1939. The latest 60% who say they drink alcohol is down slightly from 65% in 2019.
Since 1939 when Gallup first asked Americans about their use of alcohol, majorities ranging from 55% to 71% have reported they have occasion to drink. Alcohol drinking was at its highest point between 1976 and 1978.
Since the late 1990s, at least 60% of U.S. adults have consistently reported alcohol use, although Gallup did not measure this in 2020 when the nationwide lockdowns brought on by the coronavirus pandemic may have impacted Americans' drinking habits. Since 1984, the legal drinking age in the U.S. has been 21 years, and 61% of Americans aged 21 and older currently say they drink alcohol.
Alcohol Use Varies Among Demographic Subgroups
Some groups of Americans are more likely than others to report using alcohol, including men, whose 63% rate of drinking exceeds the 57% among women. Likewise, U.S. adults aged 35 to 54 are more likely to drink than their older and younger counterparts, and more college graduates say they drink alcoholic beverages than do those without a college degree. Still, majorities in each of these groups say they drink alcohol.
Less than half of U.S. adults with an annual household income of under $40,000 (44%) say they drink alcoholic beverages, while 62% of those with an income of $40,000 to $99,999 and 81% of those with an income of $100,000 or more say the same. Similarly, fewer Americans who attend religious services at least weekly (42%) report using alcohol, compared with those who attend at least monthly (61%) or less often/never (67%).
| Yes, drink | |
|---|---|
| % | |
| Gender | |
| Men | 63 |
| Women | 57 |
| Age | |
| 18 to 34 | 60 |
| 35 to 54 | 70 |
| 55 and older | 52 |
| Education | |
| College graduate | 72 |
| Not college graduate | 54 |
| Annual household income | |
| Less than $40,000 | 44 |
| $40,000 to $99,999 | 62 |
| $100,000 or more | 81 |
| Religious service attendance | |
| Every week | 42 |
| Nearly weekly/Monthly | 61 |
| Seldom/Never | 67 |
| Gallup, July 6-21, 2021 | |
Average Consumption Down Slightly as Few Say They Overindulge
Not only are fewer adults drinking alcohol today, but those who do are consuming less than they have in the recent past. Gallup tracks the number of drinks Americans say they have had in the past seven days. This year's average of 3.6 drinks includes 34% who say they had no drinks in the past week, 52% who say they had between one and seven, and 13% who say they had eight or more.
The latest average number of weekly drinks is the lowest recorded since 2001 and is more in line with reported alcohol consumption in the late 1990s and early 2000s than with more recent readings.

Line graph. Average number of alcoholic beverages U.S. adults consume in the past seven days since 1996. The current 3.6 drinks is the lowest since 2001.
Gallup also asks U.S. drinkers whether they overdo it at times. This year, 18% say they sometimes drink more than they should, which is stable and near the low point for the trend that Gallup has tracked since 1978. In the mid-to-late 1980s, roughly one in three U.S. drinkers said they sometimes drank too much.
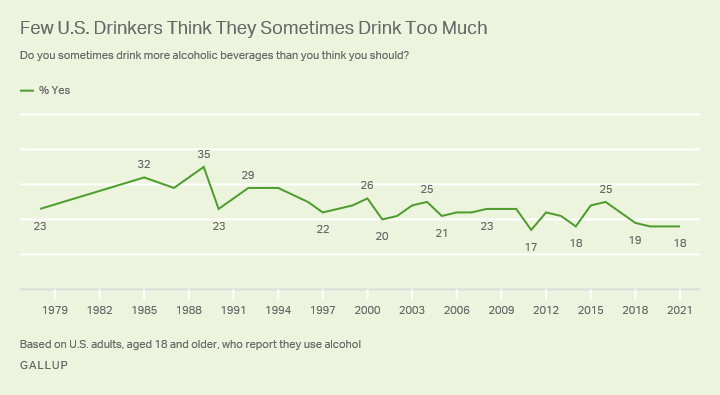
Line graph. Percentage of U.S. drinkers who say they sometimes drink more alcoholic beverages than they think they should since 1978. The latest 18% is near the 17% lowest recorded in 2011 and is essentially unchanged over the past few readings.
U.S. Drinkers Remain Most Likely to Consume Beer
While the proportion of Americans consuming alcohol and the amount they drink are down slightly compared with 2019, what they are drinking is essentially unchanged. Drinkers in the U.S. remain most likely to consume beer (39%) rather than wine (31%) or liquor (27%).
The overall trend has shown beer as the preferred drink in nearly all readings, though it is less dominant than in the 1990s when close to half said it was their preferred alcoholic beverage. Wine has been the next most popular drink, essentially tying with beer between 2011 and 2013 but more clearly trailing beer since then. Liquor has mostly lagged behind beer and wine in popularity, but it has been generally trending upward -- particularly in the past five years, including a high of 29% in 2019.

Line graph. U.S. adults' reports of the type of alcoholic beverage they drink most often, since 1992. Currently, 39% of U.S. drinkers say beer is their go to drink, 31% say it is wine and 27% say it is liquor. Beer has outpaced wine in most readings and wine has outpaced liquor nearly every time it was tracked.
As has been the case in the past, there are significant differences in drinkers' beverage of choice based on their gender, age, education and income level.
- Men are more than twice as likely as women to say they drink beer most often, and women are more than three times as likely as men to say wine is their most common beverage.
- Beer and liquor are more popular with younger drinkers, while wine is more likely to be older drinkers' preference.
- A plurality of college graduates drink wine most often, but those without a college degree are more likely to say beer is their preferred beverage.
- Those in the lower- and middle-income groups mainly choose beer as their most frequent drink, while upper-income drinkers lean toward wine.
| Beer | Wine | Liquor | |
|---|---|---|---|
| % | % | % | |
| Gender | |||
| Men | 54 | 15 | 28 |
| Women | 23 | 49 | 26 |
| Age group | |||
| 18 to 34 | 45 | 22 | 30 |
| 35 to 54 | 42 | 28 | 27 |
| 55 and older | 32 | 42 | 23 |
| Education | |||
| College graduate | 33 | 41 | 22 |
| Not college graduate | 43 | 24 | 30 |
| Annual household income | |||
| Less than $40,000 | 46 | 24 | 27 |
| $40,000 to $99,999 | 40 | 28 | 30 |
| $100,000 or more | 32 | 38 | 26 |
| Gallup, July 6-21, 2021 | |||
To stay up to date with the latest Gallup News insights and updates, follow us on Twitter.
Learn more about how the Gallup Poll Social Series works.