Story Highlights
- 43% have a favorable opinion of the Democratic Party; 40% of the GOP
- Democratic Party favorable rating down from 48% in January
- Republicans rate their own party less positively than Democrats do
WASHINGTON, D.C. -- Americans' opinions of the Democratic Party have fallen slightly from an elevated level this year, and more again view the party unfavorably (55%) than favorably (43%). Meanwhile, 56% have an unfavorable view of the Republican and 40% a favorable one. .
The three-percentage-point gap in party favorable ratings is down from 11 points earlier this year, shortly after President Joe Biden's inauguration and as the Senate was preparing to try former President Donald Trump on impeachment charges for his actions related to the January 6 Capitol Hill riot. At that point, the Democratic Party had a 48% to 37% edge in favorability.
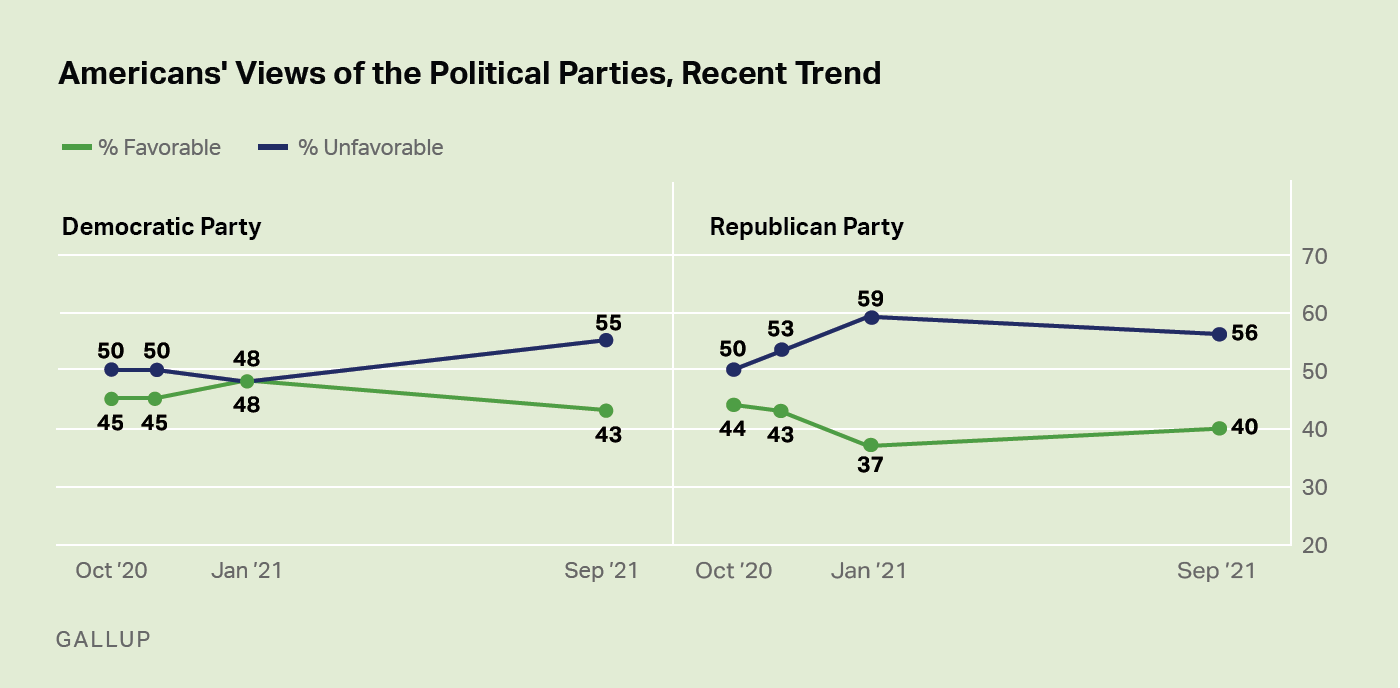
Line graphs. Recent trend in favorable and unfavorable ratings of the Democratic and Republican Parties. Forty-three percent of U.S. adults have a favorable opinion of the Democratic Party, down from 48% in January and 45% in October and November 2020. Fifty-five percent have an unfavorable opinion of the Democratic Party, higher than any other recent measure. Forty percent of U.S. adults have a favorable opinion of the Republican Party, up from 37% in January but still below 44% and 43% readings in October and November 2020, respectively. Fifty-six percent have an unfavorable opinion of the Republican Party, down from 59% in January.
The latest results are from a Sept. 1-17 Gallup poll, conducted in the wake of the chaotic U.S. withdrawal from Afghanistan, a continuing surge in U.S. coronavirus cases and an uneven economic recovery. As a result, President Joe Biden's job approval rating has fallen to the lowest of his term.
Independents Mostly Responsible for Decline in Democratic Favorability
Biden's loss of popularity, primarily among independents, is likely a factor in the lower favorable ratings of his party. The party's favorable image is also down mostly among independents, from 48% in January to 35% in the current poll.
As might be expected, Democrats' (92% favorable) and Republicans' (5% favorable) opinions of the Democratic Party are essentially unchanged, from 94% and 4%, respectively, in January.
The Republican Party's current favorable rating among all Americans is little different from the 37% recorded in January. Its favorable rating then was down six points from the prior reading in November 2020, shortly after Election Day.
In January, 78% of Republicans, 35% of independents and 10% of Democrats held a favorable opinion of the Republican Party. In the latest poll, the figures are 83% among Republicans, 38% among independents and 7% among Democrats. None of those changes are large enough to be considered statistically meaningful.
Americans Typically Rate Democratic Party Better Than GOP
Historically, Americans have been more positive toward the Democratic Party than the Republican Party. Since 2009, the average favorable rating for the Democratic Party has been 45%, compared with 40% for the GOP. Thus, the parties' current images are similar to the recent historical average.
Both parties are viewed more negatively now than they were in prior decades. From 1995, when Gallup first began routinely tracking party favorability, until 2008, the Democratic Party averaged a 54% favorable rating. Over that same period, the GOP's favorable rating was 47%, but that included several years where their average rating exceeded 50%, including 1995, 1996, 2000, and 2002 through 2004.
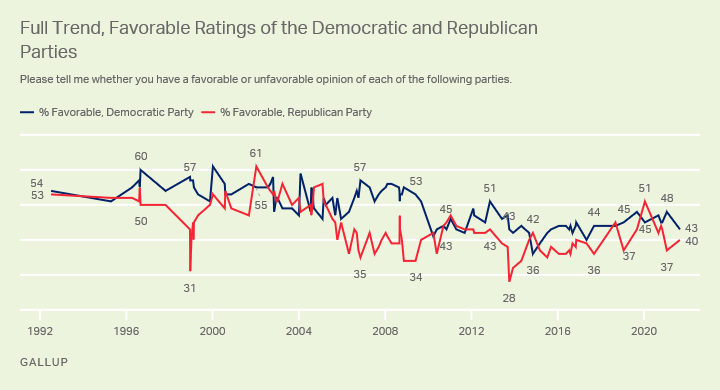
Line graph. Full trend in favorable ratings of the Democratic and Republican Parties. With only a few exceptions, Americans have historically rated the Democratic Party more positively than the Republican Party. The Republican Party has registered numerous favorable ratings below 40% in Gallup's trend, dating back to 1992. The Democratic Party has only two ratings below 40% in that time. Both parties had higher favorable ratings in the 1990s and early 2000s, with percentages of 50% or higher not uncommon.
Republicans Less Favorable Toward Their Own Party Than Democrats Are
One reason Republican favorable ratings have lagged Democrats' is that Republicans have consistently been less positive toward their own party than Democrats have been to theirs. Since 2008, Democrats' favorable rating of the Democratic Party has averaged 88%, compared with an average 82% favorable rating of the GOP among Republican Party identifiers.
The Democratic edge has been evident in nearly every Gallup poll over this time. Last year was a notable exception, with Republicans giving their party higher ratings than Democrats gave theirs in three polls conducted between January and October 2020, when Trump was running for reelection.
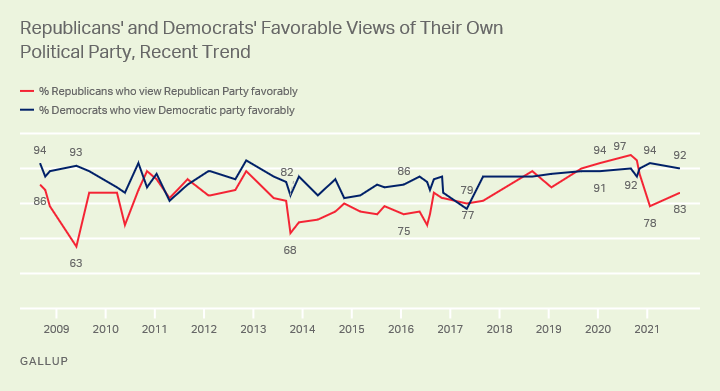
Line graph. Recent trend in favorable ratings of the Democratic Party, among Democrats, and of the Republican Party, among Republicans. In most surveys since 2008, Democrats have rated their own party more positively than Republicans have. This includes 92% of Democrats rating the Democratic Party positively now, while 83% of Republicans rate the Republican Party positively.
Democrats' favorable ratings of the Democratic Party have not averaged below 83% in any year since 2008. In fact, they have only fallen below 80% only once in any individual survey -- in May 2017, early in Trump's term when the GOP had control of both houses of Congress and the House voted to repeal the Affordable Care Act. The GOP-led Senate ultimately did not vote for repeal, and the law was left in place.
By contrast, Republicans' favorable ratings of their own party have often been below 80%, including averaging less than 80% each year between 2013 and 2016.
On two occasions since 2009, Republicans' favorable ratings of the GOP have fallen below 70%, including 63% in May 2009 after the party suffered major losses in the 2008 elections and 68% during the GOP-led federal government shutdown in October 2013.
Independents Also Typically Rate Democratic Party More Favorably
Another reason the Democratic Party usually holds an edge in favorability among all U.S. adults is that more independents typically view the Democratic Party positively than view the Republican Party positively. Democrats' advantage with independents has been modest in most years, averaging four points since 2008, 38% to 34%. There have been double-digit gaps in some individual surveys, including in 2009, 2016 and 2021.
The current survey marks one of the rarer times that independents' ratings of the two parties have been the same.
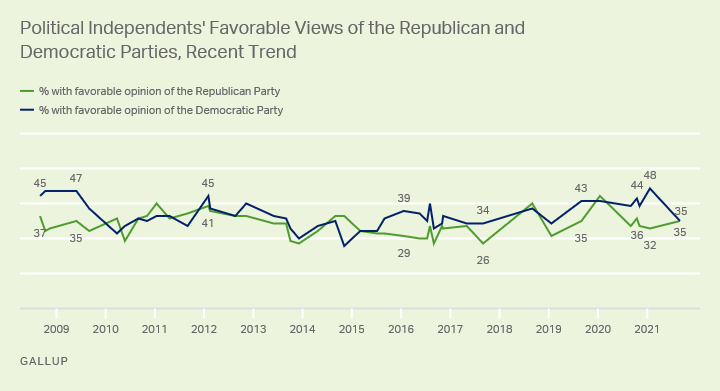
Line graph. Recent trend in favorable ratings of the Democratic Party and the Republican Party, among independents. In most surveys since 2008, independents have rated the Democratic Party at least slightly more positively than they have rated the Republican Party. This included double-digit gaps in 2009, 2016, and 2021. Currently, independents' ratings of both parties are the same, at 35% favorable.
Bottom Line
Americans hold neither party in high esteem, which has typically been the case in the past decade and helps explain the rise in independent political identification.
After a slightly higher than average image score for the Democratic Party earlier this year, Democratic favorability has slipped back to more normal levels. Biden's recent struggles have likely not helped the Democratic Party's image, although it remains close to what it was before he was elected, as does the GOP's image.
Party favorable ratings often provide clues as to how upcoming elections might go and will be an important indicator to watch as the 2022 midterm elections draw near. At this point, about a year before those elections, both parties have work to do to improve their images and convince voters to support their candidates for office.
To stay up to date with the latest Gallup News insights and updates, follow us on Twitter.
Explore President Biden's approval ratings and compare them with those of past presidents in the Gallup Presidential Job Approval Center.
Learn more about how the Gallup Poll Social Series works.