Story Highlights
- The percentage of adults classified as "thriving" drops again to 53.2%
- Thriving rates among independents have dropped steeply since June 2021
- Daily stress and worry both remain steady and near prepandemic levels
Editor's Note: The research below was conducted in partnership between West Health and Gallup.
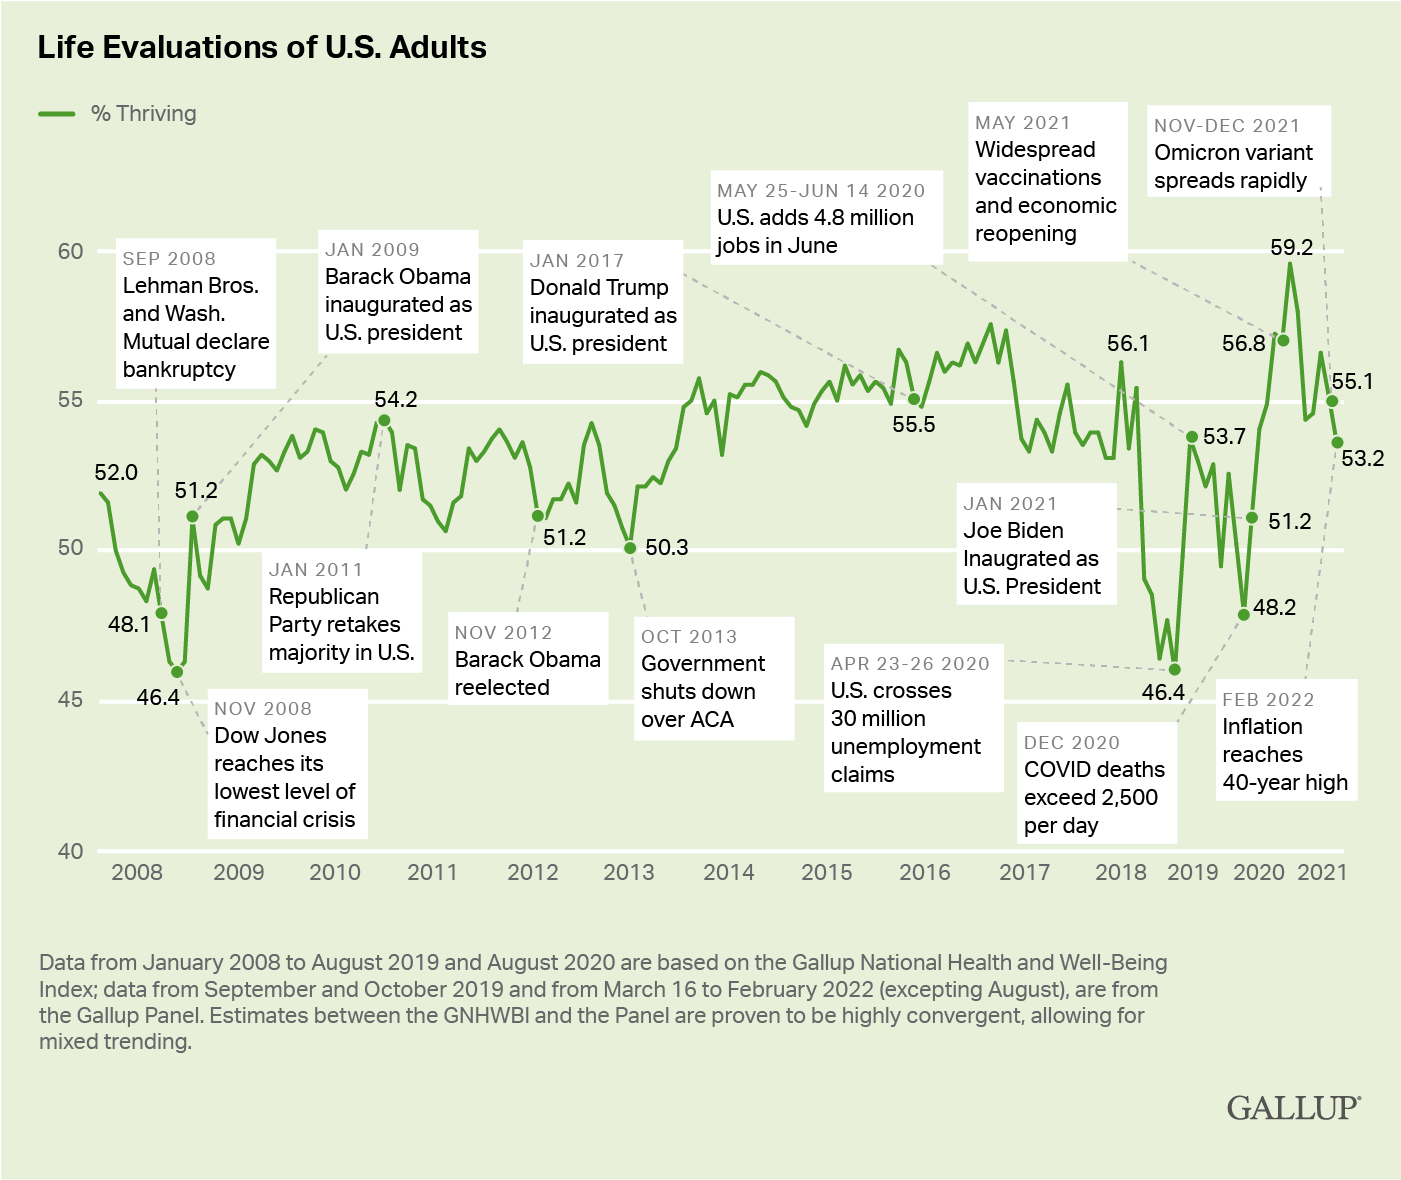
WASHINGTON, D.C. -- The percentage of Americans who evaluate their lives well enough to be considered "thriving" on Gallup's Live Evaluation Index was 53.2% in February, the lowest since January 2021. Since reaching the 14-year high mark of 59.2% in June, the thriving rate has declined six percentage points.

Line graph. The percentages of Americans who rate their lives highly enough to be considered thriving. Currently, 53.2% of Americans rate their lives highly enough to be considered thriving, down from 55.1% in December 2021.
The most recent results, captured Feb. 15-23, 2022, are based on 2,849 U.S. adults surveyed by web as a part of the Gallup Panel, a probability-based, non-opt-in panel of about 115,000 adults across all 50 states and the District of Columbia.
For its Life Evaluation Index, Gallup classifies Americans as "thriving," "struggling" or "suffering" according to how they rate their current and future lives on a ladder scale with steps numbered from zero to 10, based on the Cantril Self-Anchoring Striving Scale. Those who rate their current life a seven or higher and their anticipated life in five years an eight or higher are classified as thriving.
The percentage of Americans estimated to be "suffering," which has remained mostly steady and low throughout the pandemic, was 3.9% in February.
Thriving Rate Plummets for Republicans, Independents
Since 2020, the change in the percentage of Americans deemed to be thriving have differed by political party, partly reflecting changes in the pandemic and partly the transition from a Republican to a Democratic presidency.
Between October 2020, before the presidential election, and June 2021, when thriving nationally reached its record-high amid record-low public worry about the coronavirus, the percentage of self-identified Democrats who classified as thriving improved from 42.4% to 58.1%. The 15.7-percentage-point increase in thriving among Democrats compares with an increase of 7.1 points among independents (to 55.8%) and a 5.2-point decrease among Republicans (to 64.7%). As such, Democrats were by far the primary source of the overall national improvement of the thriving percentage in the first half of 2021.
In the eight months since that high mark, all three groups have declined, led by an 8.8-point drop among independents and followed by a 4.8-point and 4.5-point drop among Democrats and Republicans, respectively.
Overall, Republicans' thriving rate has dropped 9.7 points since October 2020, the last month before the U.S. presidential election that saw incumbent Donald Trump lose to then-candidate Joe Biden. Democrats remain up 10.9 points, while independents now are essentially unchanged.
| Oct. 2020 | Jun. 2021 | Dec. 2021 | Feb. 2022 | Change Oct. 2020 to Jun. 2021 | Change Jun. 2021 to Feb. 2022 | Change Oct. 2020 to Feb. 2022 | |
|---|---|---|---|---|---|---|---|
| % | % | % | % | pct. pts. | pct. pts. | pct. pts. | |
| Democrat | 42.4 | 58.1 | 55.3 | 53.3 | 15.7* | -4.8* | 10.9* |
| Independent | 48.7 | 55.8 | 52.0 | 47.0 | 7.1* | -8.8* | -1.7 |
| Republican | 69.9 | 64.7 | 58.1 | 60.2 | -5.2* | -4.5 | -9.7* |
| * = Statistically significant change (p<.05). Field periods: Oct. 19-Nov 1, 2020 (n=2,963), June 14-20, 2021 (n=4,820); Nov 29-Dec 5, 2021 (n=4,034); Feb 15-23, 2022 (n=2,849) | |||||||
| Gallup Panel | |||||||
Daily Stress and Worry Hit Highest Point Since December 2020
In addition to general life ratings, Gallup tracks whether Americans have recently experienced specific emotions in their daily life, including stress and worry.
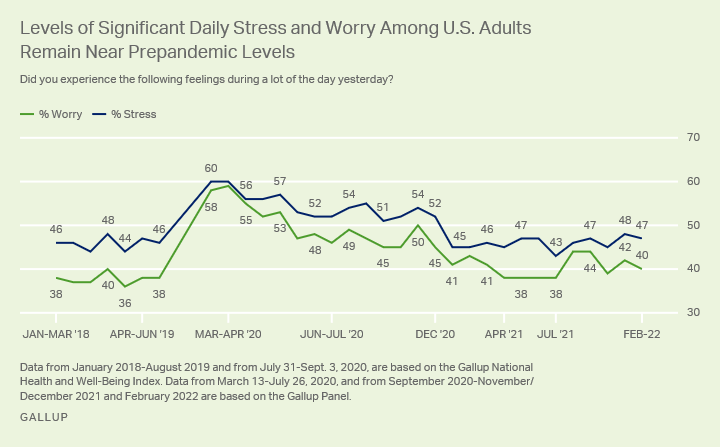
The percentage of people who reported experiencing stress and worry "a lot of the day yesterday" showed unprecedented increases in the first half of March 2020, at the start of the pandemic, with stress rising 14 percentage points to 60% and worry rising 20 points to 58%. These spikes were about four times greater than what was measured throughout 2008 due to the Great Recession.
Americans' reports of experiencing stress and worry fell to prepandemic levels by April 2021. After easing further to 43% in July 2021, daily stress has edged up to 47% of adults but remains in line with prepandemic levels, as does daily worry at 40%.

Line graph. The percentages of Americans who experienced worry or stress a lot of the previous day. Forty-seven percent of Americans experienced stress a lot of the previous day. And, 40% of those in the U.S. experienced worry a lot of the previous day.
Implications
Since reaching a record high in June 2021, the percentage of Americans classified as thriving has declined six points, alongside the worsening of several other key indicators of wellbeing. One major driver of the tumultuous movement of the trend line over the last two years is COVID-19, which has now entered its third year in the U.S. The deadly spread of the delta variant in August and September, followed by a winter surge brought on by the sharp rise of the omicron variant, has likely played a substantial role in the downturn. The arrival of the initial SARS-CoV-2 coronavirus in the U.S. in 2020 -- and the ensuing economic shutdown -- resulted in an unprecedented decline of nearly 10 percentage points in the thriving rate that spring. That makes the coronavirus's revival in the summer of 2021 and winter of 2021-2022 a probable factor in the drop. The absence of a decline of similar magnitude to what was found in the spring of 2020 could reflect a public that is less weary of COVID-19, coupled with looser restrictions in broader economic activity than those initially implemented.
Despite the absence of wide-ranging economic shutdowns, economic factors are still playing a role in the eroding thriving percentages. The U.S. Bureau of Labor Statistics recently released its Consumer Price Index for February, showing a 7.9% increase in inflation across all goods -- a 40-year high -- and a 25.6% increase in energy costs in the last 12 months. Gallup's Economic Confidence Index indicates Americans remain much more pessimistic than optimistic about the economy.
The Russian invasion of Ukraine is unlikely to have played a major role in depressed life evaluation, as the field period for this study immediately predated it. The ongoing humanitarian catastrophe in Ukraine, and significant media coverage associated with it, may well foretell further worsening of Americans' wellbeing deeper into the spring, particularly for daily experiences of worry and stress.
Politically, the drop in the thriving percentage overall, particularly among independents, is potentially bad news for Democrats in the November congressional and gubernatorial elections. Prior research involving data from 599 U.S. counties showed a strong link between low or stagnant life ratings and shifts from Democratic support in 2012 to Republican support in 2016 in the two U.S. presidential elections.
Learn more about how the Gallup National Health and Well-Being Index works.
Learn more about how the Gallup Panel works.


