The U.S. Hispanic population is a segment of growing importance on the American political scene. This reflects in large part the growth in Hispanic Americans as a percentage of the U.S. population. The Census Bureau estimates that about 19% of the U.S. population is Hispanic, based on responses to the question, "Is this person of Hispanic, Latino or Spanish origin?" That's up from 13% in 2000. Additionally, exit polls after the 2020 presidential election showed that about 13% of voters were Hispanic, up from 7% in the 2000 election.
The growth of the population of Hispanic Americans is particularly important in states where Hispanic people constitute a relatively high percentage of the state's residents. States such as New Mexico (49% Hispanic), Arizona (31%), Nevada (29%) and Florida (26%) have large Hispanic populations and are also states with the potential to swing toward either political party in national and statewide elections.
Hispanic Americans have traditionally voted Democratic. The growth in the Hispanic population could therefore suggest political gains for Democrats in the years to come. But discussion has increasingly focused on the possibility that the Hispanic population's Democratic orientation may be eroding, upsetting the traditional political calculus and giving Democratic candidates less of a margin among Hispanic Americans than in the past.
Texas provides an interesting case in point. Hispanic Americans represent 39% of the population in Texas, the nation's second-largest state. Journalists, politicians and other pundits are now raising the possibility that Hispanic Texans -- a traditional Democratic voting bloc -- may become more Republican, as exemplified by such headlines as "Why Democrats Are Losing Texas Latinos" (TexasMonthly) and "GOP Eyes Latinos in South Texas in Effort to Regain Congress" (AP News).
The Wall Street Journal recently published the results of a November national survey, with the startling headline "Hispanic Voters Now Evenly Split Between Parties, WSJ Poll Finds." As the author noted, "Asked which party they would back if the election were today, 37% of Hispanic voters said they would support the Republican congressional candidate and 37% said they would favor the Democrat, with 22% undecided." This result, were it to predict what actually occurs this November, would represent a seismic shift in national Hispanic congressional voting patterns. For comparison, 69% of Hispanic adults are estimated to have voted for the Democratic congressional candidate in the last midterm election in 2018, with 29% voting for the Republican.
Plus, as of the 2020 election, data haven't shown a lot of change in Hispanic Americans' presidential voting behavior. The 2020 presidential exit polls indicated that Hispanic voters went for Joe Biden over Donald Trump by a 2-to-1 ratio, 65% to 32%. That's very similar to 2016, when exit polls showed Hispanic voters picked Hillary Clinton over Trump by 65% to 29% (although some observers attached great meaning to the modest three-percentage-point gain in the GOP vote). But from a long-range perspective, there hasn't been much substantial change. The 2000 exit poll results, for example, indicated that Hispanic voters went for Al Gore over George W. Bush by 62% to 35%, slightly less Democratic than in the 2020 election.
Party Identification Shifts
Gallup's best mechanism for tracking political inclinations over time is political party identification, a measure included in all Gallup surveys for decades. My colleague Jeff Jones recently updated the trends on this measure among national adults. The results show that Americans' party identification swung dramatically toward the Republican Party in the last six months of 2021, from a nine-point Democratic advantage in the first quarter (as Biden was sworn in and Trump left office) to a five-point Republican advantage in the final quarter of the year. (These results are based on those who initially identify with one party or the other coupled with independents who lean toward one of the parties.) From a slightly broader perspective, Democrats had an eight-point advantage (49% Democrat to 41% Republican) in the first six months of the year, January through June, while Republicans moved to a one-point advantage (44% Democrat to 45% Republican) from July to December.
For 2021 as a whole, however, Democrats maintained a slight party ID advantage, not significantly out of line with where it has been in previous years. And Gallup's most recent monthly data from December 2021 and January of this year show that party identification is now essentially tied, suggesting that national trends in 2022 will not necessarily continue to show the Republican advantage found in 2021's final quarter.
With these national numbers as a context, what about party identification among Hispanic Americans? Gallup interviewed 1,338 Hispanic respondents in 2021, and the results show this group followed the same basic trends in party identification as noted nationally, although in a more muted fashion. Hispanic Americans' party identification shifted from a 32-point Democratic advantage from January through June (58% Democrat to 26% Republican) to a 28-point Democratic advantage from July through December (54% to 26%). This reflected a four-point decrease in Hispanic Americans' Democratic identification from the first half of the year to the second half; Republican identification was constant.
(If independent:) As of today, do you lean more to the -- [Republican Party (or) Democratic Party]?
| 2021: Jan-Jun | 2021: Jul-Dec | 2021 | |
|---|---|---|---|
| % | % | % | |
| Republican/lean Republican | 26 | 26 | 26 |
| Democrat/lean Democratic | 58 | 54 | 56 |
| Net Democratic advantage | +32 | +28 | +30 |
| Percentages for non-leaning independents and no opinion are not shown. | |||
| Gallup | |||
The aforementioned Wall Street Journal poll showing a tie among Hispanic Americans on the congressional trial heat ballot was in the field Nov. 16-22, which coincided with the shift observed in these Gallup data in the second half of the year. But the change in Gallup's party identification data among Hispanic people was relatively slight. The 28-point Democratic advantage among Hispanic adults in the second half of the year in Gallup data certainly does not provide support for a generalization from the Journal's November poll that Hispanic voters will split their choice between the two parties in this year's congressional election.
Hispanic Party ID Over Time Since 2011
Hispanic party identification for the full year 2021 was 56% Democrats/Democratic leaners and 26% Republicans/Republican leaners. This represents a 30-point Democratic margin. The trend line since 2011 shows some fluctuation in this gap over time, but no indication of a major or sustained shift. The 30-point Democratic advantage in party identification among Hispanic adults in 2021 is, in fact, greater than the 26-point Democratic margin in 2011. If there has been any change worth noting, it has been the modest decrease in the percentage of Hispanic people who identify with or lean toward the Republican Party since 2011-2014.
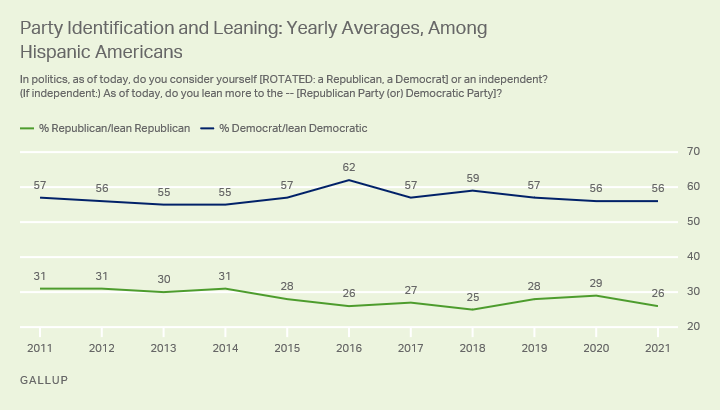
Line graph. 56 percent of Hispanic Americans say they are Democrats or Democratic-leaning independents, while 26 percent say they are Republicans or Republican leaners. The 30-percentage-point gap is similar to the differences seen since 2011.
Hispanic adults are more likely than national adults to initially identify as independents before the follow-up question that asks independents which way they lean. Specifically, 52% of Hispanic Americans in 2021 initially said they are independents (another 32% identified as Democrats and 11% as Republicans).
These results indicate that about half of Hispanic Americans have a weak allegiance to one of the two major political parties -- or no allegiance at all for the 13% who continued to say they are independent even when asked which party they lean toward. Plus, the initial 52% independent identification among Hispanic adults is 10 points higher than the 42% of all Americans who initially identified as independents in 2021. This in turn could suggest that the voting choices of Hispanic Americans may be at least slightly more up for grabs than is the case for Americans as a whole.
Bottom Line
All in all, we see few signs so far of a significant shift among Hispanic Americans away from their traditional Democratic political identity. As is the case for the larger adult population, Hispanic adults' identification with the Democratic Party did edge down in the second half of 2021, but that still left them with a 30-point Democratic margin for the year, not substantially different than over the previous decade.
Of course, party identification among all Hispanic adults nationally is a different measure than the actual behavior of the subset of Hispanic Americans who are registered and who turn out to vote. Registration rates among Hispanic people are low compared with other racial and ethnic groups, leaving more room for differences between the broad Hispanic population and the smaller population of Hispanic voters. However, it's reasonable to assume that broad trends in Hispanic Americans' party identification parallel trends in voting patterns, and so far the party ID data have not reflected major changes in Hispanic Americans' political orientation. Finally, it is important to note that trends in Hispanic party identification may be different within individual states than they are nationally.