Story Highlights
- Conservatives and moderates still tied as largest ideological groups
- Liberals remain the smallest group at 25%
- Republicans' and Democrats' ideological identification unchanged
WASHINGTON, D.C. -- The way Americans identify themselves ideologically was unchanged in 2021, continuing the close division that has persisted in recent years between those describing themselves as either conservative or moderate, while a smaller share identifies as liberal. On average last year, 37% of Americans described their political views as moderate, 36% as conservative and 25% as liberal.
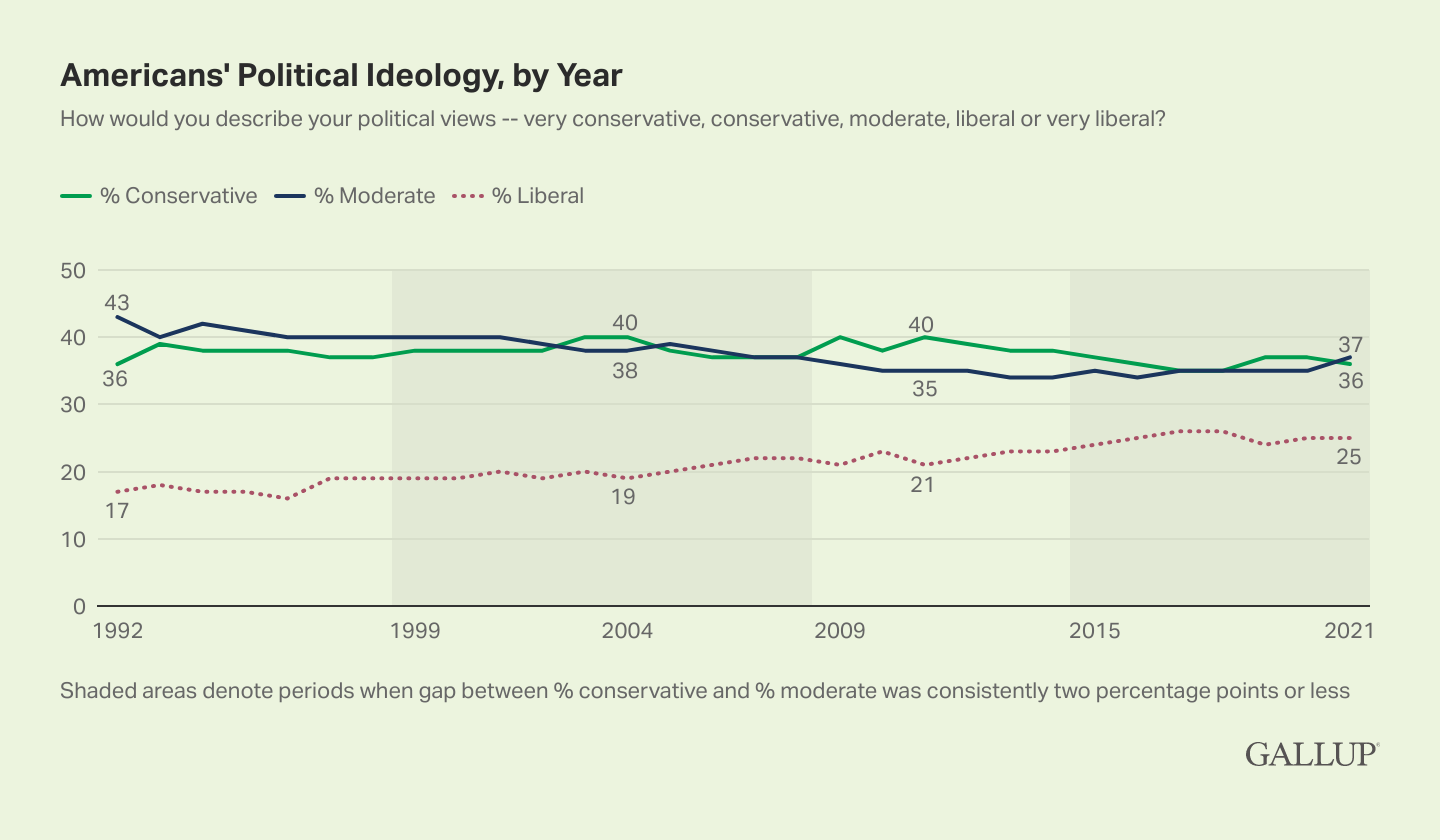
Line graph. Annual averages from 1992 to 2021 in percentages of Americans describing their political views as conservative, moderate and liberal. The percentage moderate was 43% in 1992 and gradually declined to 35% in 2011 and was 37% in 2021. The percentage conservative was 36% in 1992 and after a decade near that level rose to 40% in 2003, reaching that number four times in the next decade. It has since dipped back to the mid-30s, including 36% in 2021. The percentage liberal gradually increased from 17% to 25% in 2016 and has since held near that level, including 25% in 2021.
Gallup's political ideology trend, dating from 1992, is based on annual averages of its multiday national telephone surveys conducted throughout each year. The 2021 results encompass interviews with more than 12,000 U.S. adults. Unlike party ID, which varied considerably from one quarter to the next in 2021, Americans' description of their political views on the conservative-to-liberal spectrum showed no meaningful movement throughout the year.
Long term, Americans' political ideology hasn't varied greatly, but moderates were generally the lead group by a slight margin in most years from 1992 to 1998. Between 1999 and 2008, moderates and conservatives were about evenly matched (within two percentage points of each other) -- similar to the pattern from 2015 through today. By contrast, in a unique period from 2009 to 2014 -- the first six years of Barack Obama's presidency -- conservatives held a slight edge.
More broadly, the percentage of Americans identifying as moderate has edged down from over 40% in the early 1990s to closer to 35% over the past decade. At the same time, the percentage identifying as liberal has increased from 17% in 1992 to 25% in recent years, while the percentage conservative has been fairly flat near the 38% average.
Gallup measures Americans' political ideology by asking survey respondents whether their political views are "very conservative," "conservative," "moderate," "liberal" or "very liberal." Because relatively few people categorize themselves as "very" conservative or liberal, Gallup reports the results in three summary groups -- conservatives, moderates and liberals.
| 2020 | 2021 | |
|---|---|---|
| % | % | |
| Very conservative | 9 | 9 |
| Conservative | 28 | 27 |
| Moderate | 35 | 37 |
| Liberal | 18 | 17 |
| Very liberal | 7 | 7 |
| No opinion | 3 | 3 |
| Annual averages | ||
| Gallup | ||
Half of Democrats Still Identify as Liberal
The increase in Americans' liberal identification since the early '90s has occurred mainly among Democrats, but that has leveled off in recent years. Last year marks the fifth straight year that the percentage of Democrats describing themselves as liberal (50%) was in the 49% to 51% range after reaching that point in 2017.
The 37% of Democrats identifying as moderate and 12% as conservative are also in line with Gallup's findings over the past five years.
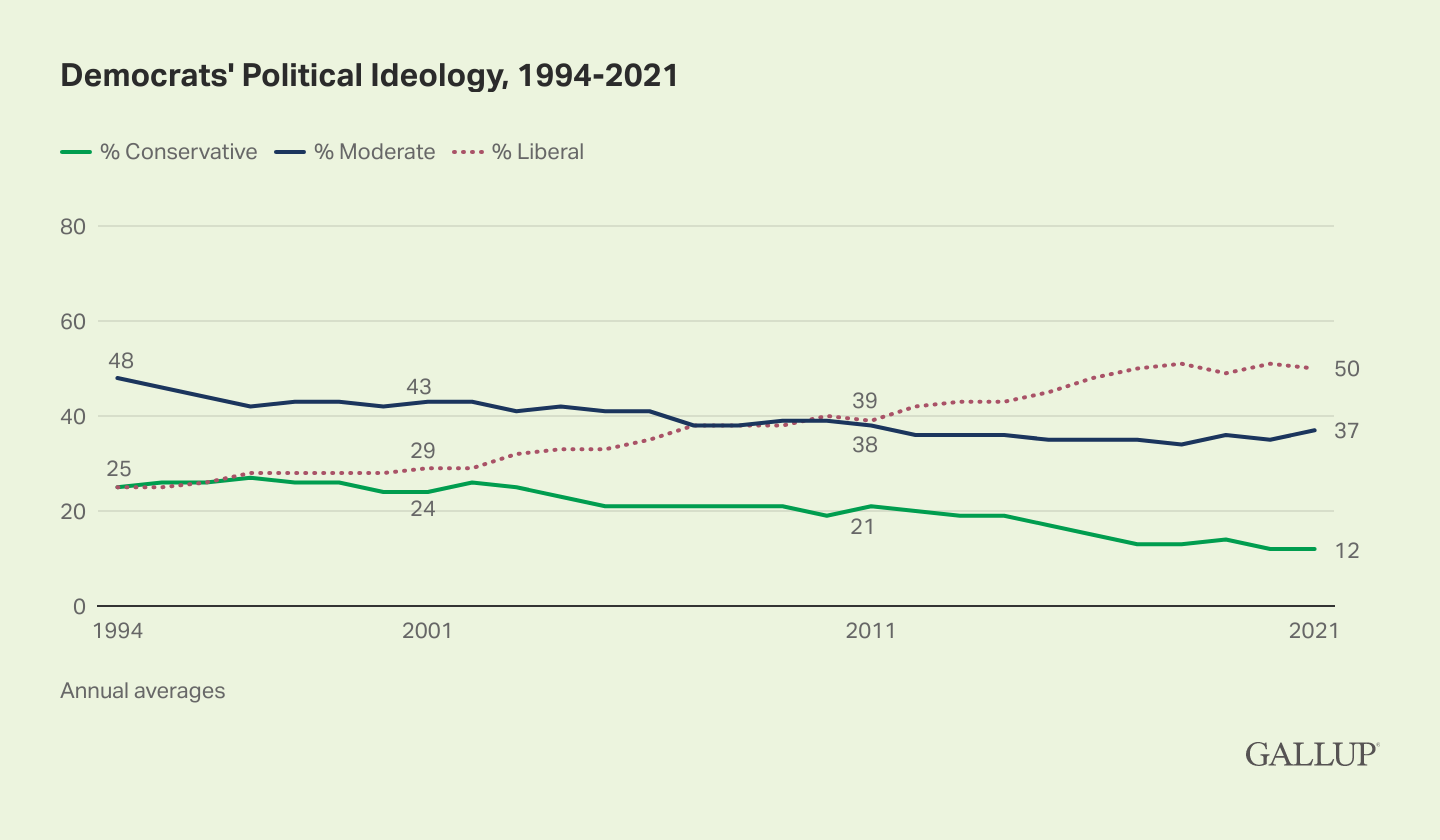
Line graph. Annual averages from 1994 to 2021 in Democrats' political ideology. The percentage identifying as liberal increased from 25% in 1994 to 50% in 2017 and has since held near that level, including 50% in 2021. Meanwhile, the percentages moderate and conservative have both declined and are now 37% and 12%, respectively.
Independents Remain More Moderate Than Conservative or Liberal
Independents' views were unchanged in 2021, with close to half (48%) identifying as moderate, 30% as conservative and 20% as liberal.
Independents' stance in recent years has been similar to what it was in the 1990s and 2000s before turning a bit more conservative during the early to mid-Obama years.
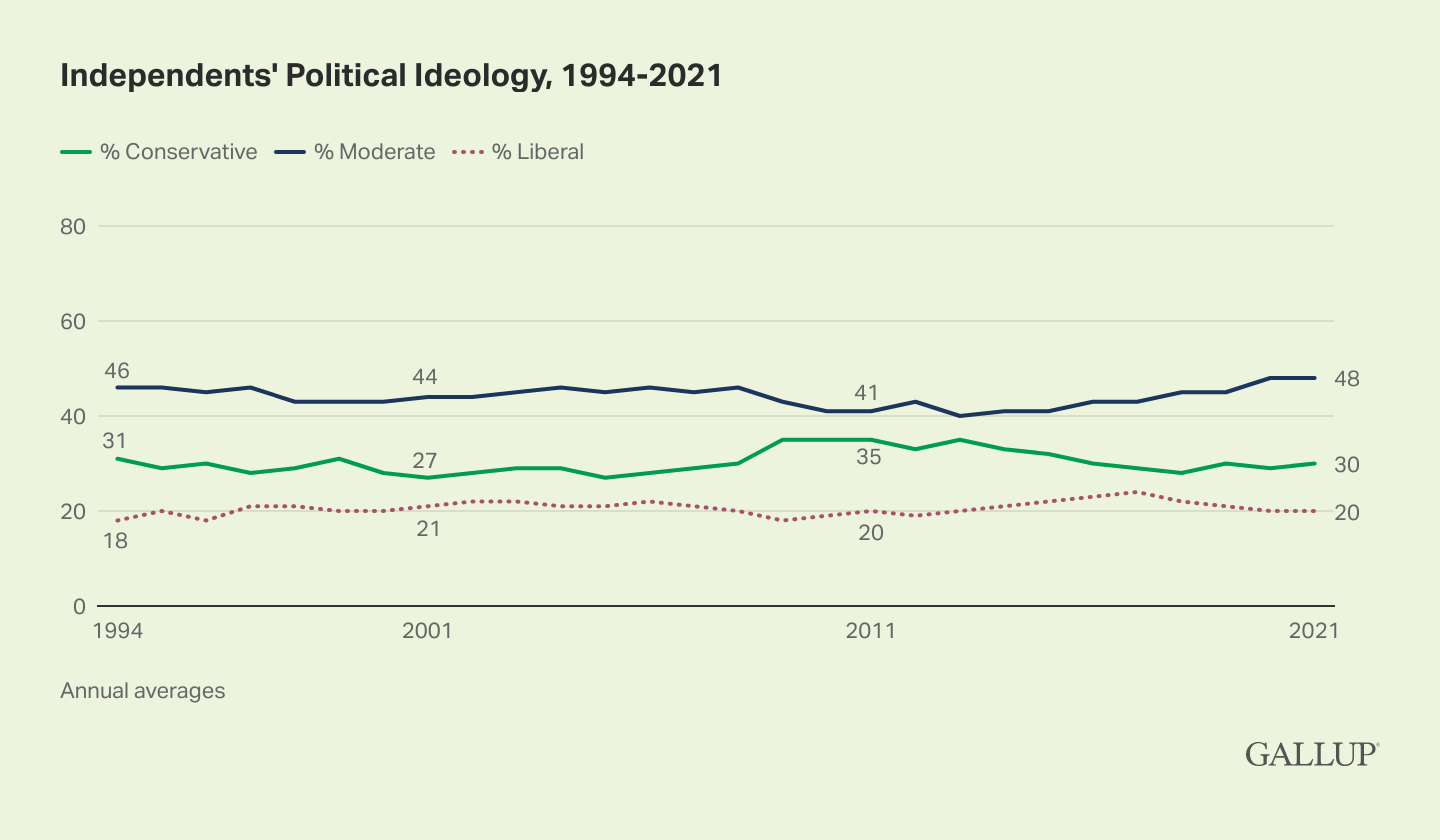
Line graph. Annual averages from 1994 to 2021 in independents' political ideology. The largest share of independents have consistently identified as moderates, including 46% in 1994 and 48% in 2021. The percentage conservative was 31% in 1994 and, after rising to 35% in most years between 2009 and 2013, it has declined back to the 30% level in 2021. The percentage liberal has been fairly steady in a range from 18% to 24%, including 20% in 2021.
Republicans Predominantly Conservative
Republicans' right-leaning stance held firm last year, with 74% identifying as conservative, 22% as moderate and just 4% as liberal.
Roughly three in four Republicans have identified as conservative each year since 2018 after the proportion rose from 70% in 2016 and from 58% in 1994.
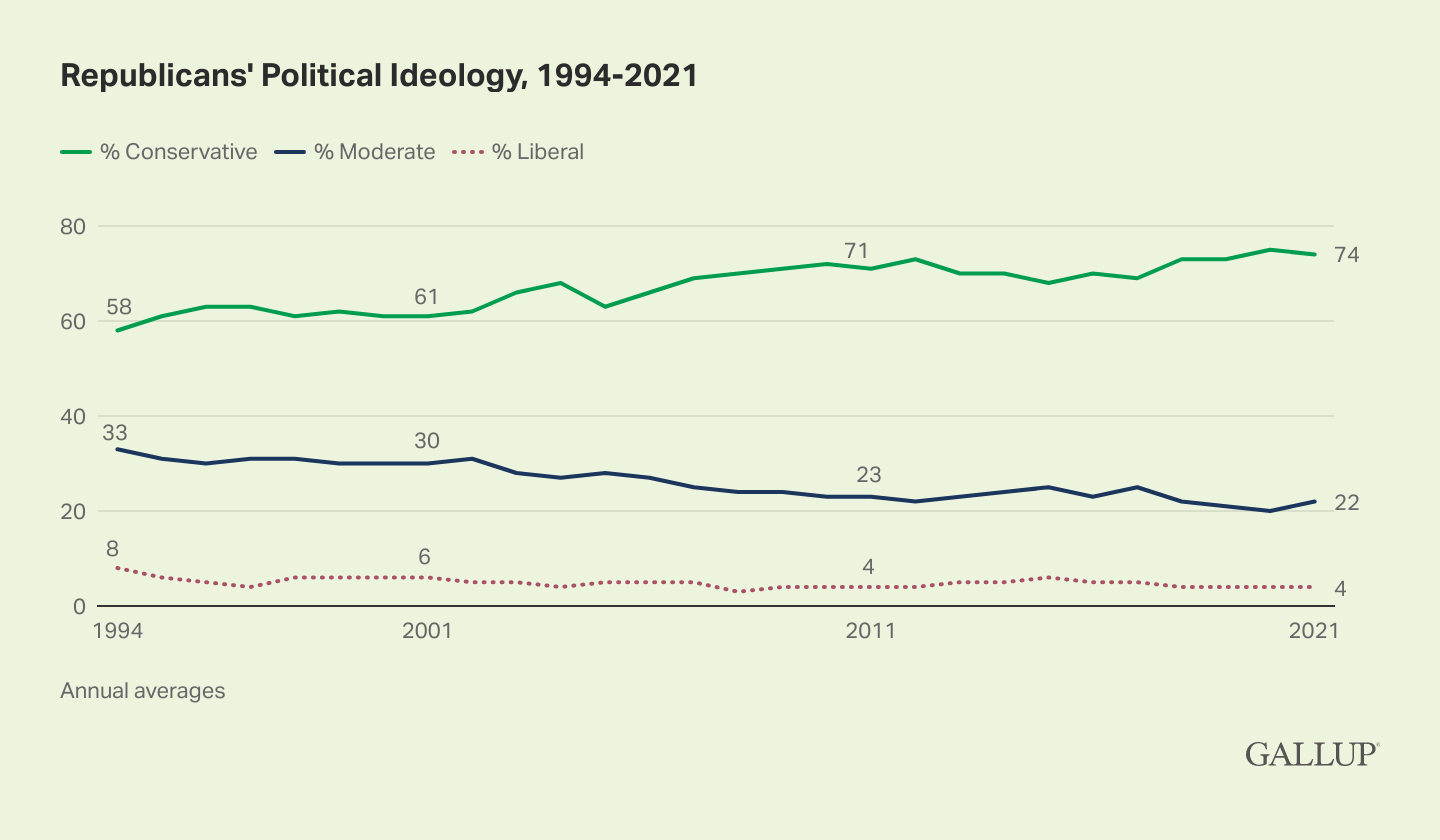
Line graph. Annual averages from 1994 to 2021 in Republicans' political ideology. The largest share of Republicans have consistently identified as conservative, rising from 58% in 1994 to 70% by 2008 and 73% by 2018. It remained at that level, at 74%, in 2021. Meanwhile, the percentage of Republicans identifying as moderate has declined from 33% in 1994 to 22% in 2021, and the percentage liberal has remained low, most recently at 4%.
Ideology Differs Modestly Among Demographic Subgroups
Aside from ideological differences by party, slim to moderate differences are seen by gender, age, education, race and geographic region.
In line with the Republican partisan orientation of these groups, men, older adults, White adults, those without a college degree and residents of the South and Midwest are more likely to identify as conservative rather than liberal.
Their counterparts in the population are either about equally as liberal as they are conservative in their political views (women, middle-aged adults, college graduates, Hispanic adults and residents of the East and West) or have more liberal than conservative identifiers (young adults, postgraduates and Black adults).
Ideology doesn't vary by household income; the plurality of all major income groups identify as moderate, and the rest are more likely to be conservative than liberal.
| Conservative | Moderate | Liberal | |
|---|---|---|---|
| % | % | % | |
| U.S. adults | 36 | 37 | 25 |
| Gender | |||
| Men | 41 | 37 | 20 |
| Women | 32 | 37 | 29 |
| Age | |||
| 18 to 29 | 23 | 41 | 34 |
| 30 to 49 | 33 | 40 | 25 |
| 50 to 64 | 43 | 36 | 19 |
| 65+ | 45 | 32 | 21 |
| Education | |||
| Postgraduate | 27 | 36 | 36 |
| College graduate only | 31 | 38 | 30 |
| Some college | 38 | 39 | 22 |
| No college | 42 | 37 | 19 |
| Household income | |||
| $100,000 or more | 36 | 38 | 26 |
| $40,000 to <$100,000 | 37 | 38 | 25 |
| Less than $40,000 | 35 | 39 | 25 |
| Race/Ethnicity | |||
| Non-Hispanic White adults | 42 | 34 | 23 |
| Non-Hispanic Black adults | 20 | 51 | 26 |
| Hispanic adults | 31 | 38 | 28 |
| Region | |||
| East | 31 | 39 | 29 |
| Midwest | 37 | 37 | 24 |
| South | 42 | 36 | 19 |
| West | 32 | 38 | 28 |
| Party ID | |||
| Republicans | 74 | 22 | 4 |
| Independents | 30 | 48 | 20 |
| Democrats | 12 | 37 | 50 |
| Based on combined monthly data from January to December 2021 | |||
| Gallup, | |||
Bottom Line
Even as the country was embroiled in debates over COVID-19 policies, U.S. voting laws, government spending and abortion, among other contentious issues, Americans' general ideological outlook held steady in 2021. As seen in previous years, more than a third each continue calling themselves conservative or moderate, and a quarter identify as liberal.
At the same time, Democrats continue to be about evenly divided between those identifying as liberal versus moderate or conservative, reflecting the broader ideological diversity within the party. Republicans remain overwhelmingly conservative, and independents continue to tilt conservative at the margins, but the largest segment is moderate.
With independents being the largest political group, and with more independents describing themselves as moderates than anything else, it may be getting harder for the two major parties to hold political power when they pursue policies too far from the middle. This may be one reason that party control of the presidency and Congress has alternated as much as it has over the past 25 years.
To stay up to date with the latest Gallup News insights and updates, follow us on Twitter.
Learn more about how the Gallup Poll Social Series works.