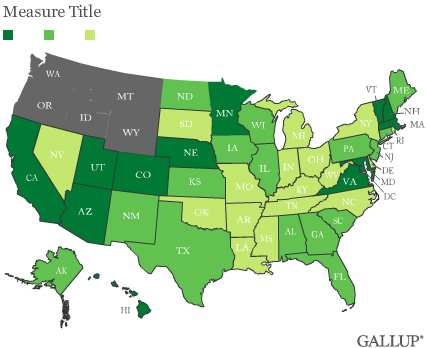
PRINCETON, N.J. -- A majority of Wyoming, Mississippi, and Utah residents identified as conservative rather than moderate or liberal during the first half of 2010, making these the most politically conservative states in the U.S. The District of Columbia had the greatest percentage of liberals, along with four New England states: Rhode Island, Connecticut, Vermont, and Massachusetts.


The group of most conservative states includes five Southern states, three Western states, and three states from the Midwest. The 10 most liberal states are primarily made up of Northeastern states, but also include the Pacific Coast states of Oregon and Washington.
In general, Americans are much more likely to identify politically as conservative than as liberal, and this has been the case for many years. As a result, the 10 most conservative states have no fewer than 46% of their residents identifying as conservative. In contrast, the 10 most liberal states have a much lower threshold of 25% liberal identifiers in their states.
For the full results for each state, see page 2.
On average, conservatives outnumber liberals by about 20 percentage points across all states. Only in the District of Columbia and Rhode Island did liberals outnumber conservatives during the first half of 2010.

Ideology and Partisanship
As one would expect, there is overlap between the most liberal and Democratic states and most conservative and Republican states. The five most liberal states and New York all appear in the top 10 most Democratic states. Likewise, six of the most conservative states (Wyoming, Utah, South Dakota, Alabama, Idaho, and Nebraska) also rank among the most Republican.
Notably, whereas Southern states comprise half of the 10 most conservative states, only Alabama from that region ranks among the most Republican. This dichotomy likely stems from the South's conservative political roots but also its historical affiliation with the Democratic Party. Southerners' affiliation with the Democratic Party has weakened in the past few decades as Southern states have become reliably Republican in voting for president and have elected increasing numbers of Republicans to Congress, governor, and state legislatures.
This story is part of a series of midyear updates on Gallup's State of the States data, to be released in July and August on Gallup.com. See the complete schedule and send your suggestion for our "readers' pick." Gallup.com will report new full-year totals in early 2011 based on all 2010 surveys.
Results are based on telephone interviews conducted as part of Gallup Daily tracking Jan. 2-June 30, 2010, with a random sample of 90,942 adults, aged 18 and older, living in all 50 U.S. states and the District of Columbia, selected using random-digit-dial sampling.
For results based on the total sample of national adults, one can say with 95% confidence that the maximum margin of sampling error is ±1 percentage point.
Margins of sampling error for individual states are higher. Most states have a margin of error of ±3 percentage points or less, though margins of error are as high as ±9 percentage points in the District of Columbia and ±8 percentage points in Wyoming, Hawaii, and North Dakota.
Each state's data are weighted to ensure they are representative of that state's adult population on demographic characteristics.
Interviews are conducted with respondents on landline telephones and cellular phones, with interviews conducted in Spanish for respondents who are primarily Spanish-speaking. Each daily sample includes a minimum quota of 150 cell phone respondents and 850 landline respondents, with additional minimum quotas among landline respondents for gender within region. Landline respondents are chosen at random within each household on the basis of which member had the most recent birthday.
Samples are weighted by gender, age, race, Hispanic ethnicity, education, region, adults in the household, cell phone-only status, cell phone-mostly status, and phone lines. Demographic weighting targets are based on the March 2009 Current Population Survey figures for the aged 18 and older non-institutionalized population living in U.S. telephone households. All reported margins of sampling error include the computed design effects for weighting and sample design.
In addition to sampling error, question wording and practical difficulties in conducting surveys can introduce error or bias into the findings of public opinion polls.
For more details on Gallup's polling methodology, visit https://www.gallup.com/.

