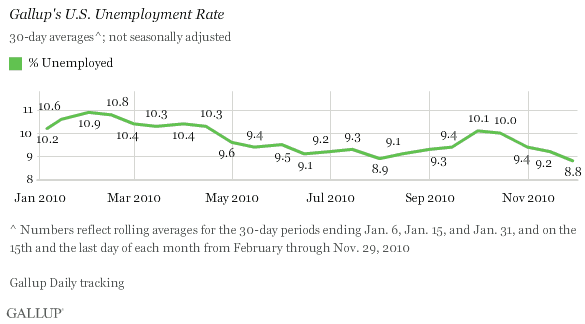
PRINCETON, NJ -- Unemployment, as measured by Gallup without seasonal adjustment, declined to 8.8% at the end of November -- down from 9.2% in mid-November and 9.4% at the end of October, and a new low for the year. While the government's unemployment report on Friday will include seasonal adjustments and is less timely than Gallup's Daily monitoring, Gallup modeling suggests that it will also show a decline.
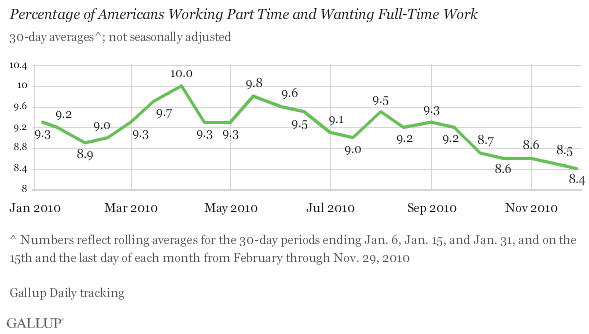
The percentage of part-time workers who want full-time work declined slightly to 8.4% of the workforce in November -- also a new 2010 low. The smaller decline for this measure compared with the unemployment measure suggests that the jobs situation is improving primarily among the unemployed right now.
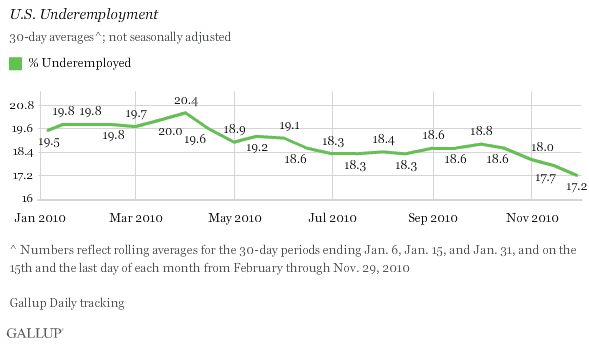
Underemployment at Lowest Level of 2010
The decline in the unemployment rate and the slight decline in the percentage of part-time workers wanting full-time work combine to bring underemployment down to 17.2%. This is a third consecutive new 2010 low, down from 17.7% in mid-November and 18% at the end of October.
Unemployment Situation Improving
Gallup's unemployment measure reflects what is actually taking place in the U.S. job market as more people are getting hired and fewer are being let go. However, it is not adjusted for seasonal trends, and companies hire more employees during the holiday season. For example, the new pop-up store phenomenon creates added employment for holidays like Halloween and Christmas. As a result, the decline in Gallup's estimate of the unemployment rate is likely more pronounced than what the government will report on Friday. Further, Gallup's Daily tracking is more up-to-date than the government's measure, which is based on mid-month job market conditions.
As a result, and as noted previously, Gallup estimates that the government's unemployment rate for November is likely to show a decline, into the 9.3% to 9.5% range. This is below the 9.6% current government unemployment rate as well as the consensus forecast of 9.7% for November. On the other hand, it appears to be consistent with Wednesday's ADP report showing increased private-sector job growth in November.
If the decline in Gallup's U.S. unemployment measure persists, it suggests that the government's unemployment rate for December could show a further decline when reported in early January. In turn, prospects for an improving jobs situation suggest good things for the nation's retailers -- particularly late in the holiday sales season -- and for the U.S. economy overall going forward.
Gallup.com reports results from these indexes in daily, weekly, and monthly averages and in Gallup.com stories. Complete trend data are always available to view and export in the following charts:
Daily: Employment, Economic Confidence and Job Creation, Consumer Spending
Weekly: Employment, Economic Confidence, Job Creation, Consumer Spending
Read more about Gallup's economic measures.
Survey Methods
Gallup classifies American workers as underemployed if they are either unemployed or working part time but wanting full-time work. The findings reflect more than 18,000 phone interviews with U.S. adults aged 18 and older in the workforce, collected over a 30-day period. Gallup's results are not seasonally adjusted and tend to be a precursor of government reports by approximately two weeks.
Results are based on telephone interviews conducted as part of Gallup Daily tracking Oct. 31-Nov. 29, 2010, with a random sample of 18,272 adults, aged 18 and older, living in all 50 U.S. states and the District of Columbia, selected using random-digit-dial sampling.
For results based on the total sample of national adults, one can say with 95% confidence that the maximum margin of sampling error is ±1 percentage point.
Interviews are conducted with respondents on landline telephones and cellular phones, with interviews conducted in Spanish for respondents who are primarily Spanish-speaking. Each daily sample includes a minimum quota of 150 cell phone respondents and 850 landline respondents, with additional minimum quotas among landline respondents for gender within region. Landline respondents are chosen at random within each household on the basis of which member had the most recent birthday.
Samples are weighted by gender, age, race, Hispanic ethnicity, education, region, adults in the household, cell phone-only status, cell phone-mostly status, and phone lines. Demographic weighting targets are based on the March 2009 Current Population Survey figures for the aged 18 and older non-institutionalized population living in U.S. telephone households. All reported margins of sampling error include the computed design effects for weighting and sample design.
In addition to sampling error, question wording and practical difficulties in conducting surveys can introduce error or bias into the findings of public opinion polls.
For more details on Gallup's polling methodology, visit www.gallup.com.