PRINCETON, NJ -- Gallup's Job Creation Index shows employees' reports of hiring activity at their places of work in January were unchanged, at +10, for the fourth consecutive month.
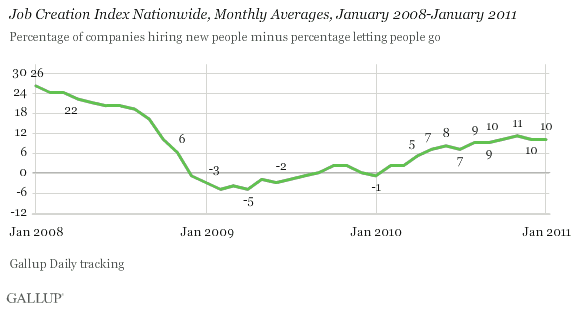
Job creation has been essentially flat after improving steadily over the first half of 2010 and stabilizing at +9 in August and September.
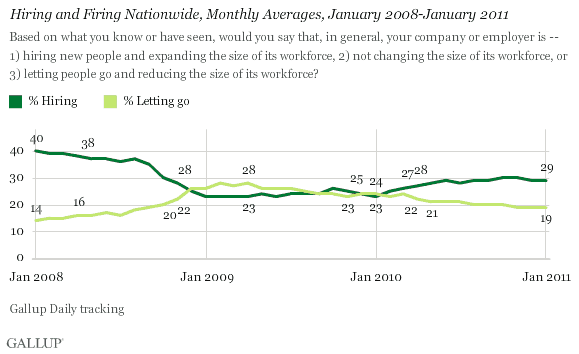
Twenty-nine percent of employees nationwide tell Gallup their companies are hiring and 19% say they are letting workers go -- precisely the same as in December, and essentially the same as in November and October.
Job Market Conditions Vary by Region
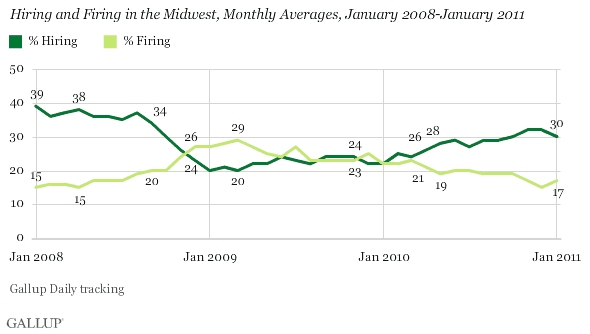
While job market conditions nationwide have been stable over the past several months, some regions are doing better than others. Conditions improved in the South during January and slowed in the Midwest, so that the two regions now match each other. At the same time, job conditions in the East and the West were essentially unchanged; as a result, the jobs situation in both of these regions continues to trail those in the South and Midwest.
Midwest Deteriorates in January
Hiring in the Midwest fell to 30% in January from 32% during the prior two months, while the firing percentage increased to 17% from 15% in December and 17% in November. As a result, the region's Job Creation Index declined to +13 in January from +17 in December and +15 in November. Despite the recent deterioration in the job climate in the Midwest, the farm and manufacturing sectors continue to improve, as does the production of other commodities in response to growing export demand. Job conditions in the Midwest remain as good now as they are in any other region.
South Job Market Improves to Match the Midwest
Job conditions in the South improved slightly in January, with the hiring percentage increasing to 31% from 30% in December and firing improving to 18% from 19% in December. The South has experienced the best job market conditions of any region over most of the past three years, but the Midwest has begun challenging for that position during recent months.
Job Market Conditions Improve Slightly in East
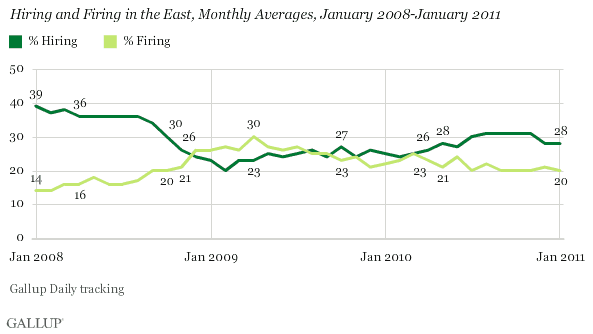
In the East, hiring was unchanged in January, at 28%. Firing was virtually unchanged, at 20%, compared with 21% the prior month. While there has been improvement in the U.S. financial sector, job conditions in the East remain closer to those in the West than they are to those in the South and Midwest.
West Continues to Trail Other Regions
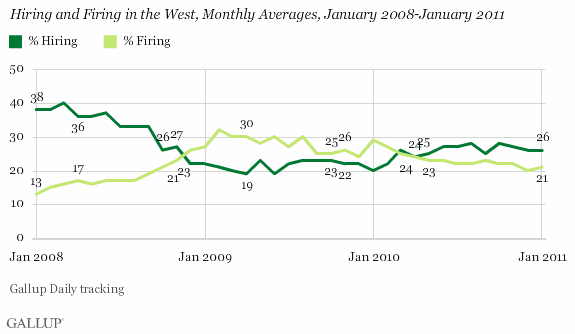
Hiring and firing in the West continues to trail that of other regions in the nation, with 26% of companies hiring and 21% letting employees go -- not much different from December. Conditions in the West have not improved since summer. The region also continues to struggle with some of the worst real estate market conditions in the U.S.
Implications
While Gallup's Job Creation Index shows that hiring and firing conditions nationwide are much better today than they were a year ago, that is not a high hurdle. The lack of improvement in job creation over the past four to six months is far more significant. Current job creation levels remain anemic and insufficient to bring about a significant reduction in today's far-too-high levels of unemployment and underemployment.
Despite the lack of overall progress in creating jobs, the regional data seem to reflect the relative strength of U.S. manufacturing and exports -- and the high price of energy -- benefiting the Midwest and South. Similarly, the continued weakness in many real estate markets and financial industry hiring is holding down relative job conditions on both coasts.
Regardless of the regional differences, however, private-sector job creation should remain a top priority going forward if the U.S. economy is going to lower unemployment and underemployment levels and achieve a sustainable economic recovery.
Gallup.com reports results from these indexes in daily, weekly, and monthly averages and in Gallup.com stories. Complete trend data are always available to view and export in the following charts:
Daily: Employment, Economic Confidence and Job Creation, Consumer Spending
Weekly: Employment, Economic Confidence, Job Creation, Consumer Spending
Read more about Gallup's economic measures.
View our economic release schedule.
Survey Methods
For Gallup Daily tracking, Gallup interviews approximately 1,000 national adults, aged 18 and older, each day the Gallup Job Creation Index results are based on a random sample of approximately 500 current full- and part-time employees each day.
National results for January are based on Gallup Daily tracking interviews with 15,617 employees conducted Jan. 2-30, 2011. For this sample, one can say with 95% confidence that the maximum margin of sampling error is ±1 percentage point. Regional results for January are based on interviews totaling more than 3,000 in each region. For each total regional sample, the maximum margin of sampling error is ±3 percentage points.
Interviews are conducted with respondents on landline telephones and cellular phones, with interviews conducted in Spanish for respondents who are primarily Spanish-speaking. Each daily sample includes a minimum quota of 200 cell phone respondents and 800 landline respondents, with additional minimum quotas among landline respondents for gender within region. Landline respondents are chosen at random within each household on the basis of which member had the most recent birthday.
Samples are weighted by gender, age, race, Hispanic ethnicity, education, region, adults in the household, cell phone-only status, cell phone-mostly status, and phone lines. Demographic weighting targets are based on the March 2010 Current Population Survey figures for the aged 18 and older non-institutionalized population living in U.S. telephone households. All reported margins of sampling error include the computed design effects for weighting and sample design.
In addition to sampling error, question wording and practical difficulties in conducting surveys can introduce error or bias into the findings of public opinion polls.
For more details on Gallup's polling methodology, visit www.gallup.com.
