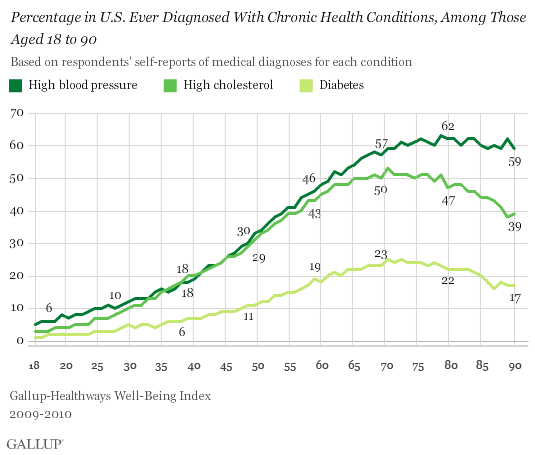
PRINCETON, NJ -- The percentages of U.S. adults ever diagnosed with high blood pressure, high cholesterol, or diabetes increase rapidly during middle age from about age 30 to 60. These percentages continue to rise through about age 75, after which they hold steady or diminish.

These findings are based on 24 months of Gallup-Healthways Well-Being Index daily tracking data from 2009 through 2010, encompassing surveys with more than 650,000 U.S. adults, aged 18 and older. The resulting sample sizes for every age from 18 through 90 -- ranging from roughly 1,500 to 18,000 cases -- allow for age-specific analysis of the data.
The Gallup-Healthways Well-Being Index measures the prevalence of high blood pressure, high cholesterol, and diabetes by asking respondents if a medical professional has ever told them they have each condition. Overall from 2009 through 2010, an average of 31% of Americans reported having ever been diagnosed with high blood pressure, 27% with high cholesterol, and 11% with diabetes. In many cases, once diagnosed, these are lifetime conditions, not episodic.
Rates of Chronic Conditions Expand Differently as Americans Age
The trends by age reveal the extent to which these diagnoses accumulate in the population as it ages, although the patterns vary by condition.
The percentage of Americans reporting they were ever told they have high blood pressure climbs steadily from 5% of 18-year-olds to 57% of 70-year-olds and then plateaus at about 60% among people in their 70s and 80s.
The pattern is slightly different for high cholesterol. The percentage ever diagnosed with this condition holds in single digits from age 18 through 31, but then rises more rapidly from 10% at age 32 to 43% at age 60. It increases further to 50% by age 66, after which it stabilizes at this level until age 80 when it starts to dip, descending below 40% by age 89.
One reason hypertension rates might stay high among older seniors, whereas high cholesterol rates do not, is that the stiffening of blood vessels with age is a strong risk factor for the disease; thus, the diagnosis mounts with age, apparently offsetting those who die of hypertension-related illnesses in old age. By contrast, high cholesterol is linked with lifestyle factors more likely to affect people's health earlier in life. Thus, more people with high cholesterol may be dying in their 70s and 80s than are being newly diagnosed with the condition during these years.
Diabetes rates are slower to accelerate in the population by age than either high blood pressure or high cholesterol. About 1% of 18-year-old adults have been diagnosed with some form of the disease -- most likely heavily represented by Type 1 diabetes. The percentage of people diagnosed with diabetes remain in the single digits through their late forties, but thereafter -- when Type 2 diabetes becomes a greater risk -- it rises more sharply reaching 23% at age 68, then falls to 17% by age 89. Given the lifetime nature of diabetes, this decline is most likely attributed to mortality.
Obesity More Than Doubles Between Age 18 and 30
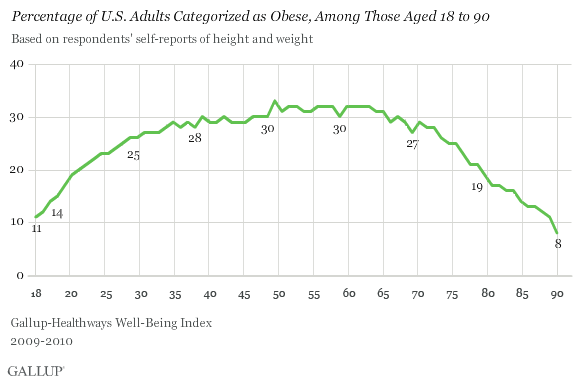
A leading cause of certain chronic conditions -- obesity -- surges in Americans' 20s, more than doubling between the ages of 18 and 30. It peaks at about age 50 and remains prevalent among Americans in their 60s and early 70s before tapering off.

The Gallup-Healthways Well-Being Index determines obesity on the basis of respondents' self-reported height and weight, using traditional Body Mass Index (BMI) scoring. Across 2009 and 2010, an average 27% of Americans were obese, defined as having a BMI of 30 or higher.
Whether the decline in obesity later in life mostly reflects the higher mortality rate of obese people as they age or significant weight loss among seniors is not clear.
To the extent that obesity remains a chronic problem for younger Americans -- that is, they do not make lifestyle changes to reduce their weight -- the prevalence of high blood pressure, high cholesterol, and diabetes may be greater for future generations of seniors. It is also possible that the rates of chronic illnesses among younger Americans today are higher than they were in the past as a result of higher rates of obesity.
Bottom Line
The proportion of Americans who have ever been diagnosed with high blood pressure, high cholesterol, or diabetes is fairly low in their 20s; however, these rates naturally increase over time, swelling to double digits among Americans in their 30s. Among people in their 40s, nearly a quarter each report having had hypertension or high cholesterol. About half of Americans in their 60s have been diagnosed with these conditions and one in five with diabetes. The rates would likely continue to compound, except for the associated mortality rates. As a result, those who survive into their 70s and 80s are typically less likely to have such chronic conditions.
At the same time, obesity affects an average of 20% of adults in their 20s and more than a quarter of adults in their 30s, likely setting Americans up for the exploding rates of weight- and diet-related chronic conditions seen later in life.
About the Gallup-Healthways Well-Being Index
The Gallup-Healthways Well-Being Index tracks U.S. and U.K. well-being and provides best-in-class solutions for a healthier world. To learn more, please visit well-beingindex.com.
Survey Methods
Results are based on telephone interviews conducted as part of the Gallup-Healthways Well-Being Index survey throughout 2009 and 2010, with a random sample of 658,578 adults, aged 18 and older, living in all 50 U.S. states and the District of Columbia, selected using random-digit-dial sampling.
For results based on the total sample of national adults, one can say with 95% confidence that the maximum margin of sampling error is ±1 percentage point.
For results based on individual age groups, the maximum margins of sampling error range from ±1 percentage point to ±3 percentages points.
Interviews are conducted with respondents on landline telephones and cellular phones, with interviews conducted in Spanish for respondents who are primarily Spanish-speaking. Each daily sample includes a minimum quota of 200 cell phone respondents and 800 landline respondents, with additional minimum quotas among landline respondents for gender within region. Landline respondents are chosen at random within each household on the basis of which member had the most recent birthday.
Samples are weighted by gender, age, race, Hispanic ethnicity, education, region, adults in the household, cell phone-only status, cell phone-mostly status, and phone lines. Demographic weighting targets are based on the March 2010 Current Population Survey figures for the aged 18 and older non-institutionalized population living in U.S. telephone households. All reported margins of sampling error include the computed design effects for weighting and sample design.
In addition to sampling error, question wording and practical difficulties in conducting surveys can introduce error or bias into the findings of public opinion polls.
For more details on Gallup's polling methodology, visit https://www.gallup.com/.
