PRINCETON, NJ -- Though the vast majority of Americans say they would vote for their party's nominee for president in 2012 if that person happens to be a Mormon, 22% say they would not, a figure largely unchanged since 1967.

The question is mainly relevant to the Republican and independent vote in 2012, given that the current Republican front-runner, Mitt Romney, is an active member of the Church of Jesus Christ of Latter-day Saints, commonly known as the Mormon church, and that another Mormon, former Utah Gov. and former Ambassador to China Jon Huntsman, may enter the race for the GOP nomination as early as next week.
The new Gallup poll, conducted June 9-12, finds nearly 20% of Republicans and independents saying they would not support a Mormon for president. That is slightly lower than the 27% of Democrats saying the same.
The largest differences in opposition to voting for a Mormon for president are by educational level, with adults who have not attended college more resistant than those with some college experience or college graduates. This educational pattern is seen in attitudes about voting for someone from almost all of the specific religious or demographic groups tested in the poll.
There are no significant differences on this question by gender, age, region of the country, or religious preference. Additionally, the views of Americans who attend their place of worship weekly are no different from those of less frequent attenders or non-attenders.

Opposition to Mormon President Among the Most Common Voting Bias
At 22%, Americans' resistance to electing a Mormon president, even one nominated by their own party, is exceeded only by their opposition to electing someone who is either gay or lesbian (32%) or an atheist (49%). By contrast, less than half as many, 10%, say they would not vote for a Hispanic, and fewer than 10% would not vote for a nominee who is Jewish, Baptist, Catholic, female, or black.

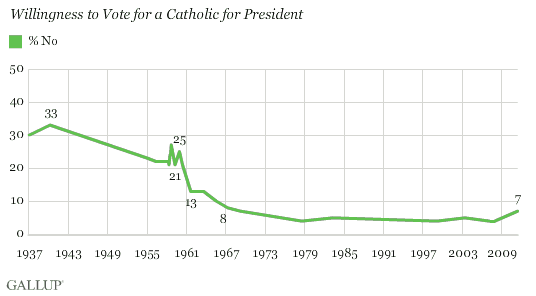
The stability in U.S. bias against voting for a Mormon presidential candidate contrasts markedly with steep declines in similar views toward several other groups over the past half-century, including blacks, women, Catholics, and Jews. The last time as many as 22% of Americans said they would not vote for any of these groups (the same level opposed to voting for a Mormon today) was 1959 for Catholics, 1961 for Jews, 1971 for blacks, and 1975 for women. As noted, opposition to voting for each of these has since tapered off to single digits.
Still, it is significant that in 1959, the year before John F. Kennedy won election as the nation's first Catholic president, 25% of Americans -- including 22% of Democrats, 33% of Republicans, and 18% of independents -- said they would not vote for a Catholic. Public opposition fell to 21% by May 1960 and to 13% by August 1961.

Bottom Line
Americans' reluctance to support a Mormon for president has held close to the 20% level since Gallup first measured this in 1967, and long after historical biases against voting for blacks, Catholics, Jews, and women have dwindled.
Currently, 18% of Republicans say they would not vote for their party's nominee if that person happened to be Mormon. This may be less troubling for Romney in the GOP primaries, where the vote could be highly fractured anyway, than in the general election, where -- should he win the Republican nomination -- he would need nearly complete support from Republicans to be competitive with President Obama. However, Kennedy's success in overcoming a similar challenge in 1960 relating to his Catholic faith may give hope to Romney and his supporters about his electability in 2012.
Survey Methods
Results for this Gallup poll are based on telephone interviews conducted June 9-12, 2011, on the Gallup Daily tracking survey, with a random sample of 1,020 adults, aged 18 and older, living in all 50 U.S. states and the District of Columbia.
For results based on the total sample of national adults, one can say with 95% confidence that the maximum margin of sampling error is ±4 percentage points.
Interviews are conducted with respondents on landline telephones and cellular phones, with interviews conducted in Spanish for respondents who are primarily Spanish-speaking. Each sample includes a minimum quota of 400 cell phone respondents and 600 landline respondents per 1,000 national adults, with additional minimum quotas among landline respondents for gender within region. Landline telephone numbers are chosen at random among listed telephone numbers. Cell phone numbers are selected using random-digit-dial methods. Landline respondents are chosen at random within each household on the basis of which member had the most recent birthday.
Samples are weighted by gender, age, race, Hispanic ethnicity, education, region, adults in the household, and phone status (cell phone only/landline only/both, cell phone mostly, and having an unlisted landline number). Demographic weighting targets are based on the March 2010 Current Population Survey figures for the aged 18 and older non-institutionalized population living in U.S. telephone households. All reported margins of sampling error include the computed design effects for weighting and sample design.
In addition to sampling error, question wording and practical difficulties in conducting surveys can introduce error or bias into the findings of public opinion polls.
View methodology, full question results, and trend data.
For more details on Gallup's polling methodology, visit www.gallup.com.
