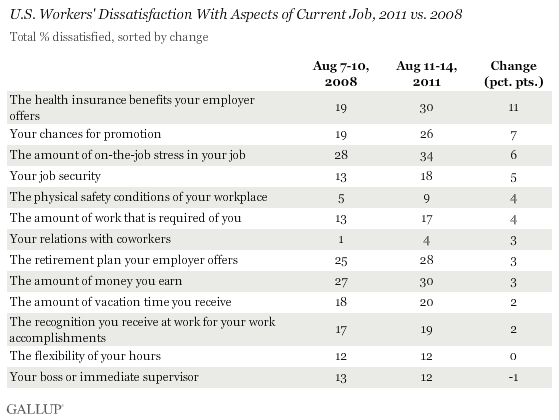
WASHINGTON, D.C. -- U.S. workers are more dissatisfied today with their health insurance benefits and their chances for promotion than they were before the global economic collapse. These are the biggest movers since August 2008 on a list of 13 specific job aspects Gallup tracks.

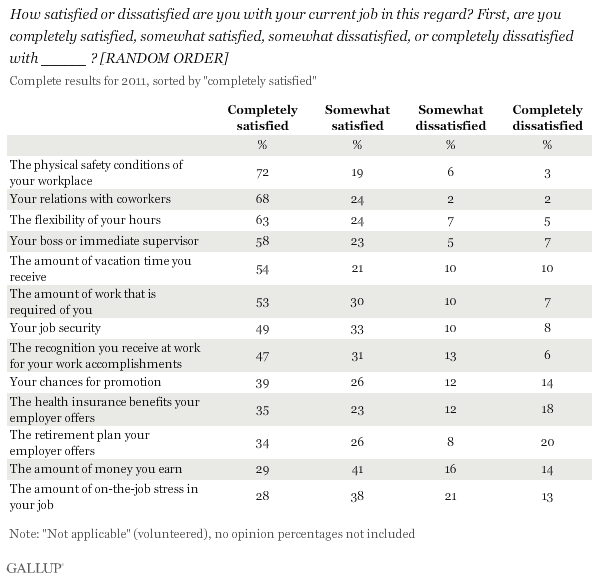
The findings are from Gallup's annual Work and Education poll, conducted Aug. 11-14, 2011. The majority of workers are at least somewhat satisfied with these job aspects, which Gallup asks about each year, but often fewer than half are completely satisfied. On-the-job stress remains the aspect workers' are least positive about overall, as it was last year, with 28% of workers completely satisfied. Workers remain the most satisfied with the physical safety conditions of their workplace, with 72% completely satisfied.
Between those extremes, workers tend to be more satisfied with the people they work with -- namely, their coworkers and boss -- and their schedule in terms of flexibility, vacation time, and amount of work required than they are with what they get in return. Fewer than half are completely satisfied with the recognition they receive, their chances for promotion, their health insurance benefits, the retirement plan their employer offers, and the amount of money they earn.

Just under half of workers, 49%, tell Gallup they are completely satisfied with their job security. Gallup in the same poll found 30% of workers worried about being laid off in the near future, near the all-time high.
Together, the findings point toward an issue that may be bubbling under the surface of the nation's unemployment problem. With more workers than jobs, workers who do have jobs may be staying in jobs that they are less satisfied with. Further, employers who are struggling financially may be cutting back on salaries, promotions, and health benefits -- to the dissatisfaction of workers for whom those aspects may count more than ever. Indeed, 83% of workers in this survey say they are satisfied with their job overall, compared with 90% before the recession. However, the survey did not ask workers about their level of engagement with their work and workplace, which Gallup research has documented as an even more important measure of productivity and job creation.
Long-Term View Provides More Positive Picture
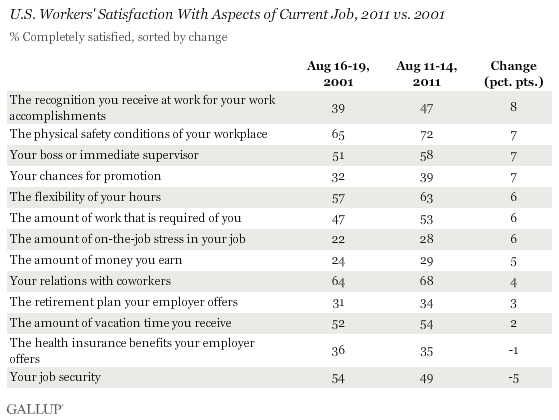
Although negativity has edged higher over the past three years, workers' satisfaction with these 13 aspects of their job is generally stable or improved from 10 years ago, when the economy was also struggling with the bursting of the dot-com bubble. Only workers' satisfaction with their job security has trended slightly lower since August 2001.

Implications
Workers' perceptions about their jobs deserve as much attention from leaders as the nation's unemployment rate and the need to create new jobs. More than one in four workers remain dissatisfied with the tangible things they get in return for their work, which could affect their willingness to work harder for the good of their employer and the economy more broadly, not to mention their own willingness to spend. At the same time, employers may face an understandable dilemma between hiring new workers and better compensating the ones they have. As such, these measures provide yet another important gauge of the nation's true economic health.
Survey Methods
Results for this Gallup poll are based on telephone interviews conducted Aug. 11-14, 2011, with a random sample of 489 adults, aged 18 and older, employed full- or part-time and living in all 50 U.S. states and the District of Columbia.
For results based on the total sample of employed adults, one can say with 95% confidence that the maximum margin of sampling error is ±6 percentage points.
Interviews are conducted with respondents on landline telephones and cellular phones, with interviews conducted in Spanish for respondents who are primarily Spanish-speaking. Each sample includes a minimum quota of 400 cell phone respondents and 600 landline respondents per 1,000 national adults, with additional minimum quotas among landline respondents by region. Landline telephone numbers are chosen at random among listed telephone numbers. Cell phone numbers are selected using random-digit-dial methods. Landline respondents are chosen at random within each household on the basis of which member had the most recent birthday.
Samples are weighted by gender, age, race, Hispanic ethnicity, education, region, adults in the household, and phone status (cell phone only/landline only/both, cell phone mostly, and having an unlisted landline number). Demographic weighting targets are based on the March 2010 Current Population Survey figures for the aged 18 and older non-institutionalized population living in U.S. telephone households. All reported margins of sampling error include the computed design effects for weighting and sample design.
In addition to sampling error, question wording and practical difficulties in conducting surveys can introduce error or bias into the findings of public opinion polls.
View methodology, full question results, and trend data.
For more details on Gallup's polling methodology, visit www.gallup.com.
