PRINCETON, NJ -- Underemployment, a measure that combines the percentage of workers who are unemployed with the percentage working part time but wanting full-time work, is 18.4% in mid-December, as measured by Gallup without seasonal adjustment. This is up slightly from 18.1% at the end of November and similar to the 18.5% of a year ago.
Unemployment, one of the two components of underemployment, is at 8.7% in mid-December -- up from 8.5% at the end of last month, but down from 9.3% a year ago. Gallup's unemployment measure suggests the government is likely to report essentially no change for December 2011 in its seasonally adjusted unemployment rate, though this is even more difficult than usual to predict at this time of year.
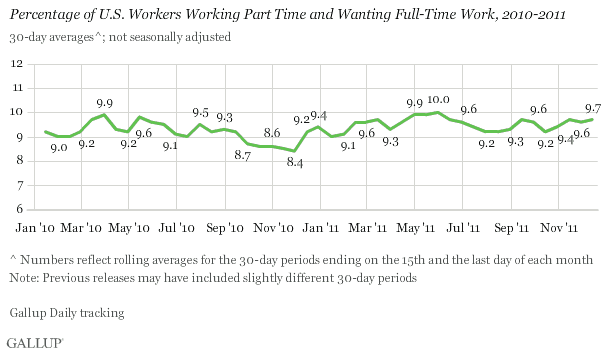
The second component of underemployment is the percentage of U.S. employees who are working part time but want full-time work. It is now at 9.7% -- essentially the same as the 9.6% at the end of November. However, the current reading is significantly higher than the 9.2% of mid-December 2010.
December Job Creation Index Down in Most Recent Week
Gallup's Job Creation Index for the week ending Dec. 11 is +12, based on 30% of workers nationwide saying their employers are hiring and 18% saying their employers are letting workers go. Just a week earlier, Gallup's Job Creation Index tied its weekly high for the year (+16). Still, Gallup's latest weekly results contrast sharply with the government's recent report that jobless claims fell to a three-year low during the week ending Dec. 10.
Gallup's Job Creation Index and the government's jobless claims report tend to have an inverse relationship and generally tend to align. Although this alignment does not necessarily happen on a weekly basis, it tends to be more erratic around the holidays as seasonal adjustments and processing issues make weekly jobless claims more volatile.
Growing Unemployment Optimism May Be Premature
The sharp drop in the government-reported unemployment rate for November and the sharp drop in jobless claims during the most recent reporting week have combined to create the perception that the job market may be improving. Economists are wondering whether this means the economy is stronger than previously estimated. Political observers are wondering how fast and how far the unemployment rate needs to fall to significantly improve the president's re-election prospects.
In contrast, Gallup's data suggest little improvement in the jobs situation. December unemployment is up slightly on an unadjusted basis. In fact, the government is likely to report essentially no change in the unemployment rate when it issues its report on December unemployment in the first week of 2012. Of course, this assumes that the labor force doesn't continue to shrink at so rapid a pace that it drives down the unemployment rate, as it did last month.
Gallup's most recent weekly job creation numbers also suggest little improvement in the jobs situation. As a result, it may be wise to exercise caution in interpreting the drop in the government's most recent jobless claims numbers.
Further, one reason unemployment is often seen as a lagging indicator has to do with the way people enter and leave the workforce. Even if the recent seeming improvement in the job market is more real than Gallup's data imply, signs of a better job market are likely to bring new job seekers into the workforce. The result could be a reversal of last month's drop in the unemployment rate as the workforce increases in size.
In sum, while pleasant thoughts about the job market may be nice for the holidays, caution is clearly warranted -- at least as far as too much job market optimism is concerned -- until the data unfold over the next couple of months.
Gallup.com reports results from these indexes in daily, weekly, and monthly averages and in Gallup.com stories. Complete trend data are always available to view and export in the following charts:
Daily: Employment, Economic Confidence and Job Creation, Consumer Spending
Weekly: Employment, Economic Confidence, Job Creation, Consumer Spending
Read more about Gallup's economic measures.
View our economic release schedule.
Survey Methods
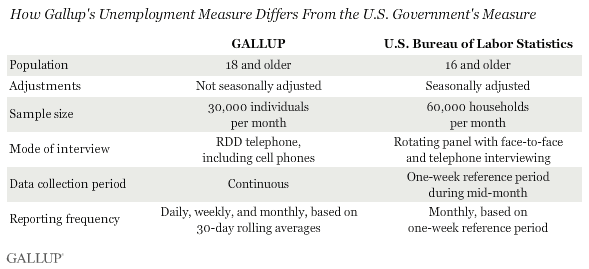
Gallup classifies American workers as underemployed if they are either unemployed or working part time but wanting full-time work. The findings reflect more than 18,000 phone interviews with U.S. adults aged 18 and older in the workforce, collected over a 30-day period. Gallup's results are not seasonally adjusted and are ahead of government reports by approximately two weeks.
Results are based on telephone interviews conducted as part of Gallup Daily tracking from Nov. 16 to Dec. 14, 2011, with a random sample of 18,258 adults, aged 18 and older, living in all 50 U.S. states and the District of Columbia, selected using random-digit-dial sampling.
For results based on the total sample of national adults, one can say with 95% confidence that the maximum margin of sampling error is ±1 percentage point.
Interviews are conducted with respondents on landline telephones and cellular phones, with interviews conducted in Spanish for respondents who are primarily Spanish-speaking. Each sample includes a minimum quota of 400 cell phone respondents and 600 landline respondents per 1,000 national adults, with additional minimum quotas among landline respondents by region. Landline telephone numbers are chosen at random among listed telephone numbers. Cell phone numbers are selected using random-digit-dial methods. Landline respondents are chosen at random within each household on the basis of which member had the most recent birthday.
Samples are weighted by gender, age, race, Hispanic ethnicity, education, region, adults in the household, and phone status (cell phone only/landline only/both, cell phone mostly, and having an unlisted landline number). Demographic weighting targets are based on the March 2010 Current Population Survey figures for the aged 18 and older non-institutionalized population living in U.S. telephone households. All reported margins of sampling error include the computed design effects for weighting and sample design.
In addition to sampling error, question wording and practical difficulties in conducting surveys can introduce error or bias into the findings of public opinion polls.
For more details on Gallup's polling methodology, visit www.gallup.com.
