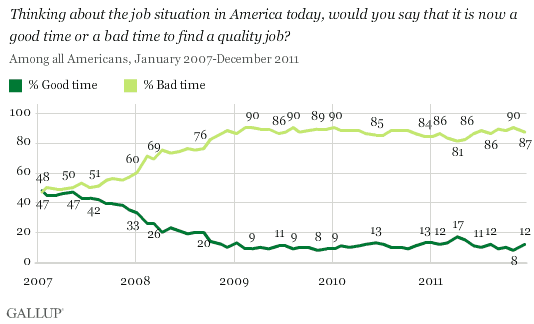
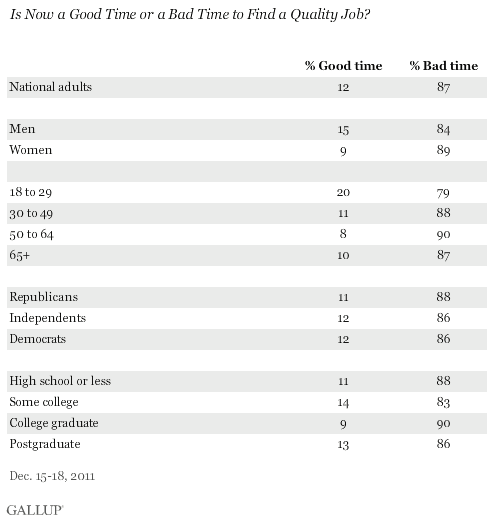
PRINCETON, NJ -- Americans' assessments of the quality job market improved slightly in December from November's record low. Eighty-seven percent say it is now a "bad time" to find a quality job -- down from 90% in November, but still slightly worse than the 84% of a year ago. Similarly, 12% think it is a "good time" -- up slightly from 8% last month, and essentially the same as the 13% of a year ago.

Perceptions that it is a good time to find a quality job peaked at 48% in January 2007, prior to the recession. The best ratings this year were in April, when 17% said it was a good time to find a quality job.
Women, Older Americans Provide Even Lower Ratings
Younger Americans aged 18 to 29 are slightly more optimistic about the quality jobs picture, with one in five saying it is a good time to find a quality job. Men tend to be more optimistic than women. On the other hand, older Americans are slightly more pessimistic. There is little difference by political party.

Implications
In December, slightly more Americans perceive that quality jobs are available than was the case last month. This is consistent with the government's November unemployment report and Thursday's report of 364,000 jobless claims in the latest week -- a decline of 4,000, and the lowest level for jobless claims since April 2008.
On the other hand, the outlook for a quality job is no better now than it was a year ago. This aligns with Gallup's recent underemployment findings and with Gallup's recent job creation measurements.
It may help holiday spending that Americans are less pessimistic about the job situation now than they were a month ago. Whether Americans' perceptions will continue to improve in early 2012 remains to be seen.
Survey Methods
Results for all Americans are based on telephone interviews conducted Dec. 15-18, 2011, with a random sample of 1,019 national adults, aged 18 and older, living in all 50 U.S. states and the District of Columbia.
For results based on the total sample of national adults, one can say with 95% confidence that the maximum margin of error is ±4 percentage points.
Interviews are conducted with respondents on landline telephones and cellular phones, with interviews conducted in Spanish for respondents who are primarily Spanish-speaking. Each sample includes a minimum quota of 400 cell phone respondents and 600 landline respondents per 1,000 national adults, with additional minimum quotas among landline respondents by region. Landline telephone numbers are chosen at random among listed telephone numbers. Cell phone numbers are selected using random-digit-dial methods. Landline respondents are chosen at random within each household on the basis of which member had the most recent birthday.
Samples are weighted by gender, age, race, Hispanic ethnicity, education, region, adults in the household, and phone status (cell phone only/landline only/both, cell phone mostly, and having an unlisted landline number). Demographic weighting targets are based on the March 2010 Current Population Survey figures for the aged 18 and older non-institutionalized population living in U.S. telephone households. All reported margins of sampling error include the computed design effects for weighting and sample design.
In addition to sampling error, question wording and practical difficulties in conducting surveys can introduce error or bias into the findings of public opinion polls.
View methodology, full question results, and trend data.
For more details on Gallup's polling methodology, visit www.gallup.com.
