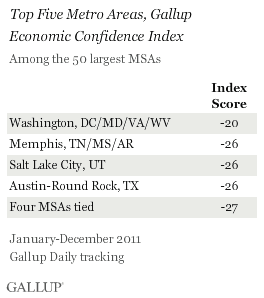
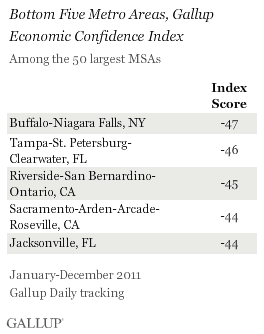
PRINCETON, NJ -- Residents of the Washington, D.C., metro area expressed the greatest confidence in the U.S. economy last year among the largest metro areas, with a score of -20 on Gallup's Economic Confidence Index. That was six points higher than second-place Memphis, Salt Lake City, and Austin. Buffalo and Tampa-St. Petersburg had the lowest economic confidence.
 |
| Explore complete state data > |
These results are based on data from 2011 Gallup Daily tracking, using the subset of more than 80,000 U.S. adults living in the 50 most populous metropolitan statistical areas. This includes a minimum of 579 interviews in each MSA, and 1,000 or more interviews in 28 of the 50 MSAs reported here.
Gallup's Economic Confidence Index summarizes Americans' ratings of current national economic conditions (as excellent, good, only fair, or poor) and assessments of whether the U.S. economy is getting better or worse. The Index has a theoretical maximum of +100 and a theoretical minimum of -100.
Nationally, in 2011, Gallup's Economic Confidence Index was -37, indicating Americans were more negative than positive about the economy. In 34 of the largest 50 MSAs, the index score was -36 or better, suggesting Americans living in more heavily populated areas of the country tended to be a bit more optimistic about the economy last year. For the full list of economic confidence scores by metro area, see page 2.
The Washington area's place atop the list of most confident MSAs is consistent with Gallup's finding that the District of Columbia's economic confidence score topped that of all states last year. The economic confidence score for just the District of Columbia was -4, suggesting that residents in the surrounding parts of Virginia, Maryland, and West Virginia were a bit less confident about the economy than those living in the District itself, given the entire metro area's score of -20.
Washington, San Antonio Most Upbeat About Current Economy
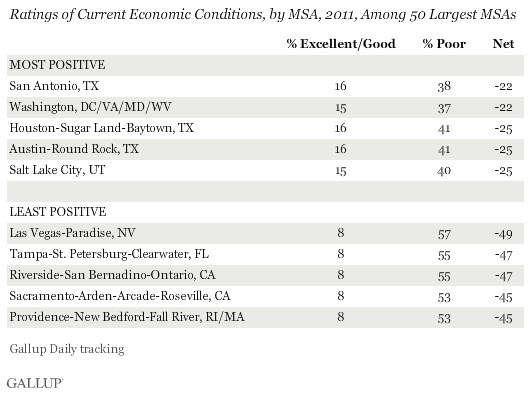
Washington, D.C.,-area residents, along with San Antonio residents, were the most positive about current economic conditions last year relative to other large metros, although both were about twice as likely to rate conditions "poor" as to rate them "excellent" or "good." Those living in or near Houston, Austin, and Salt Lake City were also more upbeat about the economy.
Las Vegas-area residents had the most negative ratings of economic conditions, followed by those living in the Tampa-St. Petersburg and Riverside, Calif., areas.
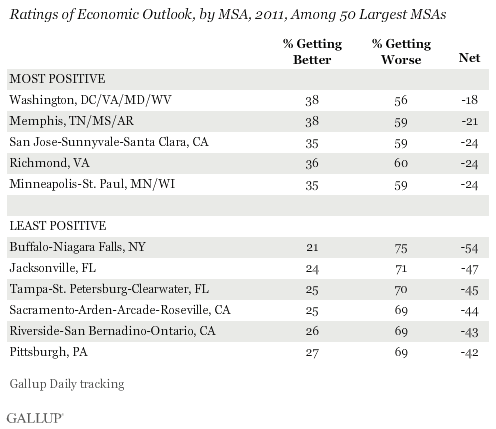
Washington-area residents were also most upbeat about the economy's direction, with 38% saying it was getting better compared with 56% getting worse, for a net economic outlook score of -18. Those living in or near Buffalo were the most pessimistic about the economy's course, with 75% saying it was getting worse and 21% better, for a net score of -54. Thus, Buffalo's standing as the lowest-rated large MSA on overall economic confidence was driven in large part by its residents' pessimism about the direction in which the economy was headed.
Confidence Related to Job Market Conditions
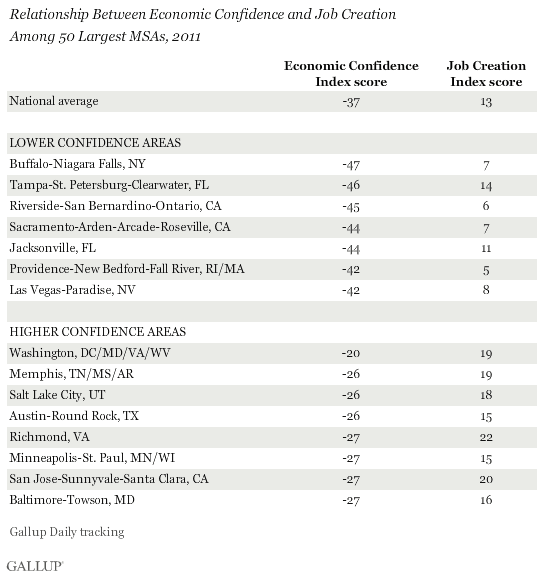
Many of the large metro areas that rank near the bottom of the economic confidence listings also rank near the bottom in Gallup's Job Creation Index. This includes Buffalo, Riverside, Sacramento, Providence, and Las Vegas, which rank in the bottom seven on both measures. The New York metro area had one of the lower job creation scores (6), but had average confidence (-36).
The link between the two measures is less strong for areas with higher economic confidence. Only Richmond, Va., ranked near the top of both lists. Oklahoma City had the highest score on the Job Creation Index, while its -32 Economic Confidence score was 18th. However, all of the areas with the highest confidence scores had above-average Job Creation Index scores.
Implications
The local and national job markets will be an important factor in the level of confidence Americans have in the economy this year. Gallup has already seen a steady improvement in economic confidence thus far in 2012, perhaps influenced by the government's more positive reports on unemployment in the last two months.
The improvement in economic confidence nationally also means confidence is sure to be improving in most metro areas as well, suggesting a 2012 update on these data will present a more positive picture than the 2011 data.
Survey Methods
Results are based on telephone interviews conducted as part of Gallup Daily tracking January-December 2011 with a random sample of 81,050 adults, aged 18 and older, living in the 50 largest U.S. metropolitan statistical areas.
Margins of error for individual metro areas are ±4 percentage points or less in all but six MSAs (Jacksonville, Memphis, New Orleans, Buffalo, Raleigh, and Birmingham, all at ±5 percentage points).
Interviews are conducted with respondents on landline telephones and cellular phones, with interviews conducted in Spanish for respondents who are primarily Spanish-speaking. Each sample includes a minimum quota of 400 cell phone respondents and 600 landline respondents per 1,000 national adults, with additional minimum quotas among landline respondents by region. Landline telephone numbers are chosen at random among listed telephone numbers. Cell phone numbers are selected using random-digit-dial methods. Landline respondents are chosen at random within each household on the basis of which member had the most recent birthday.
Samples are weighted by gender, age, race, Hispanic ethnicity, education, region, adults in the household, and phone status (cell phone only/landline only/both, cell phone mostly, and having an unlisted landline number). Demographic weighting targets are based on the March 2011 Current Population Survey figures for the aged 18 and older non-institutionalized population living in U.S. telephone households. All reported margins of sampling error include the computed design effects for weighting and sample design.
In addition to sampling error, question wording and practical difficulties in conducting surveys can introduce error or bias into the findings of public opinion polls.
For more details on Gallup's polling methodology, visit www.gallup.com.
