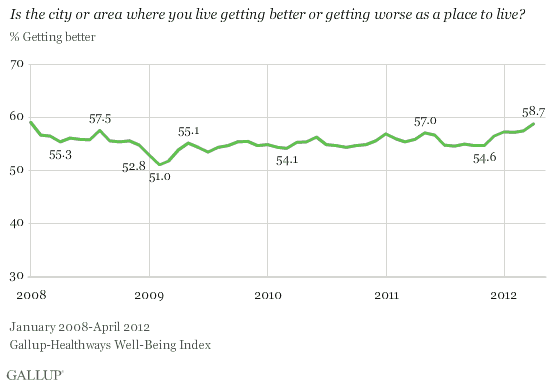
WASHINGTON, D.C. -- The 58.7% of Americans who said their city or area where they live is "getting better" in April is the highest since the 59.0% measured in January 2008, and has surpassed pre-financial crisis levels.

The Gallup-Healthways Well-Being Index tracks community satisfaction and optimism on a daily basis. These findings are based on approximately 30,000 interviews with American adults conducted each month from January 2008 through April 2012.
The percentage of Americans who said their city or area is getting better slowly declined leading up to the financial crisis in the first half of 2008, and fell to an all-time low of 51.0% in February 2009.
After reaching 57.0% in May 2011, Americans' optimism about their cities declined to the 54% range in the summer and fall of 2011. City optimism had dropped to an 11-month low at the same time that economic optimism hit a 26-month low in August 2011. Now optimism appears to be increasing again -- mirroring Americans' improving economic optimism and overall life evaluation ratings.
Americans Generally Positive About Current Conditions in Their City
Americans expressed a high level of satisfaction with current conditions in their city, as has been the case since Gallup and Healthways started tracking this metric. The 85.7% who said they were satisfied with their city in April is on par with the highest readings on record and is higher than what was found throughout 2008 and early 2009.
Still, it is important note that the percentage of Americans satisfied with their city or area has stayed in a narrow range between 83.9% and 86.1% over the past four and a quarter years. Americans' satisfaction with where they live dropped to a low of 83.9% in November 2008 -- amid the financial crisis. The highest level of satisfaction on record came one year later in November 2009, at 86.1%.

Further, Americans were much more satisfied with their local situation than they were with the national situation. In a May 3-6 Gallup poll, 24% of Americans were satisfied with the way things are going in the country, compared with the current 85.7% who say they are satisfied with their city or area. This reflects Americans' tendency to be more positive about local situations than about national conditions.
Bottom Line
Americans' increasing optimism about the future of their community is a hopeful sign that improvements in the national economy may be positively affecting residents at the local level. It is particularly important for local leaders to closely monitor residents' perceptions of the city or area where they live so they can retain and attract residents to develop thriving communities.
View the metropolitan areas with the highest and lowest levels of city optimism in 2011.
About the Gallup-Healthways Well-Being Index
The Gallup-Healthways Well-Being Index tracks well-being in the U.S., U.K., and Germany and provides best-in-class solutions for a healthier world. To learn more, please visit well-beingindex.com.
Survey Methods
Results are based on telephone interviews conducted as part of the Gallup-Healthways Well-Being Index with a random sample of approximately 30,000 adults, aged 18 and older, living in all 50 U.S. states and the District of Columbia, selected using random-digit-dial sampling. The results for April reflect 28,215 interviews conducted April 1-30, 2012.
For results based on the total sample of national adults, one can say with 95% confidence that the maximum margin of sampling error is ±0.6 percentage points.
Interviews are conducted with respondents on landline telephones and cellular phones, with interviews conducted in Spanish for respondents who are primarily Spanish-speaking. Each sample includes a minimum quota of 400 cell phone respondents and 600 landline respondents per 1,000 national adults, with additional minimum quotas among landline respondents by region. Landline telephone numbers are chosen at random among listed telephone numbers. Cell phone numbers are selected using random-digit-dial methods. Landline respondents are chosen at random within each household on the basis of which member had the most recent birthday.
Samples are weighted by gender, age, race, Hispanic ethnicity, education, region, adults in the household, and phone status (cell phone only/landline only/both, cell phone mostly, and having an unlisted landline number). Demographic weighting targets are based on the March 2010 Current Population Survey figures for the aged 18 and older non-institutionalized population living in U.S. telephone households. All reported margins of sampling error include the computed design effects for weighting and sample design.
In addition to sampling error, question wording and practical difficulties in conducting surveys can introduce error or bias into the findings of public opinion polls.
For more details on Gallup's polling methodology, visit www.gallup.com.
