WASHINGTON, D.C. -- U.S. nongovernment workers reported worse job creation conditions in September than they have in any month since February. Gallup's Job Creation Index score of +21 among nongovernment workers is down from +23 in August and a high of +25 in April. At the same time, the job creation climate within state and local government became even more positive, helping to sustain U.S. job creation nationally.

Gallup's Job Creation Index scores reflect the difference between the percentage of workers who say their employer is hiring and expanding the size of its workforce and the percentage who say their employer is letting workers go and reducing the size of its workforce. In September, the Job Creation Index scores for state and local government increased to +6 and +5, respectively, from +3 each in August. The current data reflect a significant improvement from the start of 2012 and are the best scores since state and local job creation plummeted into negative territory in the fall of 2008.
At the same time, September's Job Creation Index score for the federal government was steady at -13, compared with -12 in August. Federal government workers have now reported more downsizing than hiring in every month since June 2011. The current score is similar to the -14 of last September and only slightly better than the record-low -19 recorded in December 2011.
Nongovernment workers, which include private- and nonprofit-sector workers, continue to report the most job creation overall, but September's score marks a retreat from the higher numbers of the previous six months and a movement toward the level seen at the start of the year. Because nongovernment workers make up more than 80% of the monthly sample of employed workers, the decline in that sector helped push the overall national average slightly lower in September.
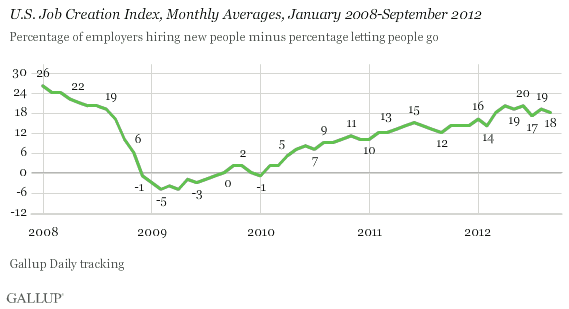
The nation's Job Creation Index score fell last month to +18, from +19 in August, with 35% of workers saying their employer is hiring and 17% saying their employer is letting workers go. The plurality (42%) continue to say their employer is not changing the size of its workforce. The national figures have hovered around this point since March, reflecting slightly more job creation than in the post-recession months prior to that.

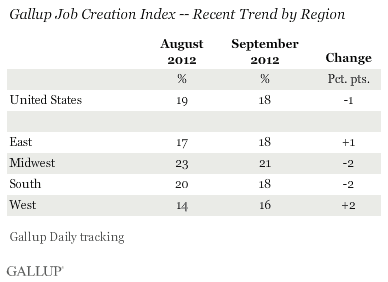
The range in job-creation perceptions by region narrowed slightly in September compared with August. Workers in the regions with the best job markets, the Midwest and the South, reported slightly less job creation, while workers in the regions with the weakest job markets, the East and West, reported slightly more.

Implications
Complications abound in the current U.S. job creation picture. On the one hand, nongovernment-sector workers continue to report conditions as good as or better than those seen before the global economic collapse. At the same time, the situation has deteriorated in comparison with the previous six months.
State and local governments currently provide a bright spot, but it is unclear whether their hiring will continue at its current pace after the first months of a new fiscal year and as budget shortfalls remain a widespread issue. The federal government continues to be a drag on U.S. job creation, but with the U.S. deficit remaining a major source of concern for Americans and politicians alike, and the "fiscal cliff" looming, this is not likely to change anytime soon.
As such, private-sector job creation remains crucial to improving the nation's overall jobs picture, a viewpoint stressed by a World Bank report released Monday. This week's reports from ADP, Gallup, and the U.S. Bureau of Labor Statistics will shed more light on the current climate, but it is unlikely that any of these will suggest a surge in job creation or full-time employment well above what has been recorded since March.
Gallup has also documented that politics are clearly influencing economic perceptions at this point, just over a month before the U.S. presidential election. If either job seekers or employers become more optimistic about the economy and take new action to successfully secure or create jobs, it could help improve the nation's job creation picture. At the same time, if just as many job seekers or employers become more negative or take a wait-and-see attitude before the election, the situation risks remaining stagnant at best.
Gallup.com reports results from these indexes in daily, weekly, and monthly averages and in Gallup.com stories. Complete trend data are always available to view and export in the following charts:
Daily: Employment, Economic Confidence, Job Creation, Consumer Spending
Weekly: Employment, Economic Confidence, Job Creation, Consumer Spending
Read more about Gallup's economic measures.
View our economic release schedule.
Survey Methods
Results are based on telephone interviews conducted as part of Gallup Daily tracking survey Sept. 1-30, 2012, with a random sample of 17,296 adults, aged 18 and older, employed full or part time, living in all 50 U.S. states and the District of Columbia.
For results based on the total sample of employed adults, one can say with 95% confidence that the maximum margin of sampling error is ±1 percentage point.
Interviews are conducted with respondents on landline telephones and cellular phones, with interviews conducted in Spanish for respondents who are primarily Spanish-speaking. Each sample includes a minimum quota of 400 cell phone respondents and 600 landline respondents per 1,000 national adults, with additional minimum quotas among landline respondents by region. Landline telephone numbers are chosen at random among listed telephone numbers. Cell phone numbers are selected using random-digit-dial methods. Landline respondents are chosen at random within each household on the basis of which member had the most recent birthday.
Samples are weighted by gender, age, race, Hispanic ethnicity, education, region, adults in the household, and phone status (cell phone only/landline only/both, cell phone mostly, and having an unlisted landline number). Demographic weighting targets are based on the March 2011 Current Population Survey figures for the aged 18 and older non-institutionalized population living in U.S. telephone households. All reported margins of sampling error include the computed design effects for weighting and sample design.
In addition to sampling error, question wording and practical difficulties in conducting surveys can introduce error or bias into the findings of public opinion polls.
For more details on Gallup's polling methodology, visit www.gallup.com.
