PRINCETON, NJ -- Gallup's U.S. Job Creation Index was little changed in November, averaging +18 for the month, similar to +19 in October and +18 in September.
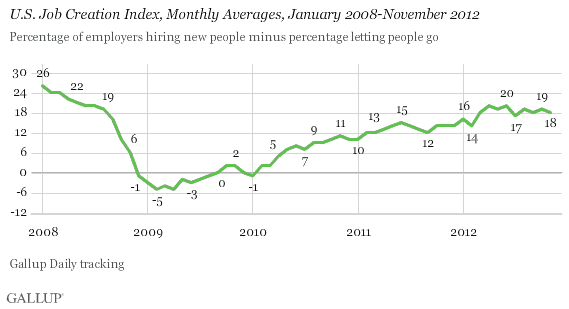
The Job Creation Index has been steady at just under +20 since July, after modest improvement earlier this year. The index previously plateaued at roughly +14 from April 2011 to February 2012. The plateau came after nearly 2 ½ years in which, through fairly steady gains, the index climbed out of the negative territory it occupied in early 2009 into consistently positive territory by early 2010.
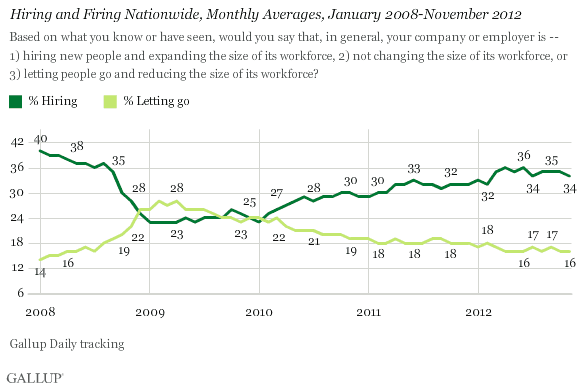
November's results are based on 34% of U.S. adult workers saying their employers are hiring and expanding the size of their workforces, and 16% saying their employers are letting workers go and reducing the size of their workforces. Both components of the index have been steady in recent months.
Recent Gains in State and Local Government Hiring Maintained in November
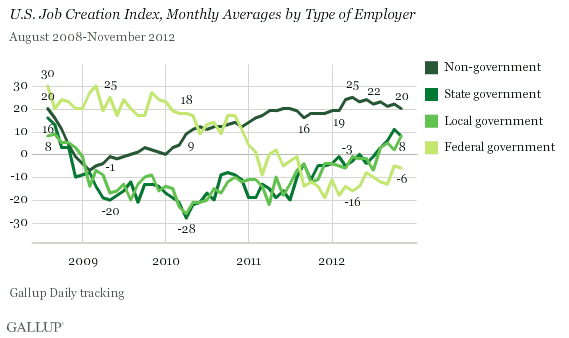
Despite stability in the overall index since July, Gallup has found an increase in hiring at the state and local government levels. Federal government hiring improved less sharply from -10 in July to -6 in November, after dipping significantly lower in August and September. The net result is that federal hiring remains net negative, while state and local government hiring has shifted in recent months from net negative to net positive.
Over the same five-month period, non-government hiring has declined, and November's index of +20 is the lowest in Gallup's monthly averages since February.
Longer term, however, non-government hiring is back to where it was in the late summer of 2008. State and local government hiring is now similar to the levels seen in late 2008, while federal government hiring remains sharply down.
Midwest Retains Hiring Edge Over Other Regions
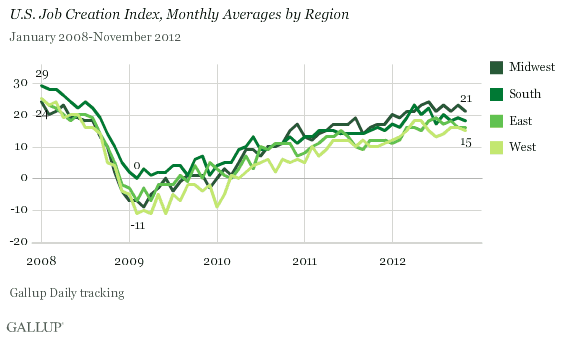
The Job Creation Index varies less by region than by type of employer, although the Midwest continues to show slightly stronger hiring than the other regions. Net hiring is currently +21 there, versus +18 in the South, +16 in the East, and +15 in the West.
The Midwest has tended to lead the other regions in net hiring since mid-2010. By contrast, from 2008 through mid-2010, the South was the strongest region for net hiring. The West has most often trailed the other regions, or has been tied with the East for having the lowest net hiring scores. From a broad perspective, though, the four regions have had similar trend lines since 2008.
Bottom Line
U.S. job creation held fairly steady in November, according to employees' reports of hiring and layoff activity where they work. Overall net hiring averaged +18, similar to Gallup's monthly averages since July. However, this stability masks some important shifts in major employment sectors, with state and local government hiring gaining momentum since July and private-sector hiring waning over the same period. How much those changes reflect real economic forces versus psychological uncertainty about the economy and the political environment prior to the election is unknown. However, Washington policymakers may want to consider the downward drift in private-sector hiring and the recovery in state and local government hiring as they debate the nation's taxing and spending options relative to the "fiscal cliff."
Gallup.com reports results from these indexes in daily, weekly, and monthly averages and in Gallup.com stories. Complete trend data are always available to view and export in the following charts:
Daily: Employment, Economic Confidence, Job Creation, Consumer Spending
Weekly: Employment, Economic Confidence, Job Creation, Consumer Spending
Read more about Gallup's economic measures.
View our economic release schedule.
Survey Methods
Results are based on telephone interviews conducted as part of Gallup Daily tracking Nov. 1-30, 2012, with a random sample of 16,681 adults, aged 18 and older, employed full or part time, living in all 50 U.S. states and the District of Columbia.
For results based on the total sample of employed adults, one can say with 95% confidence that the maximum margin of sampling error is ±1 percentage point.
Interviews are conducted with respondents on landline telephones and cellular phones, with interviews conducted in Spanish for respondents who are primarily Spanish-speaking. Each sample includes a minimum quota of 400 cellphone respondents and 600 landline respondents per 1,000 national adults, with additional minimum quotas among landline respondents by region. Landline telephone numbers are chosen at random among listed telephone numbers. Cellphone numbers are selected using random-digit-dial methods. Landline respondents are chosen at random within each household on the basis of which member had the most recent birthday.
Samples are weighted by gender, age, race, Hispanic ethnicity, education, region, adults in the household, and phone status (cellphone only/landline only/both, cellphone mostly, and having an unlisted landline number). Demographic weighting targets are based on the March 2011 Current Population Survey figures for the aged 18 and older non-institutionalized population living in U.S. telephone households. All reported margins of sampling error include the computed design effects for weighting and sample design.
In addition to sampling error, question wording and practical difficulties in conducting surveys can introduce error or bias into the findings of public opinion polls.
For more details on Gallup's polling methodology, visit www.gallup.com.
