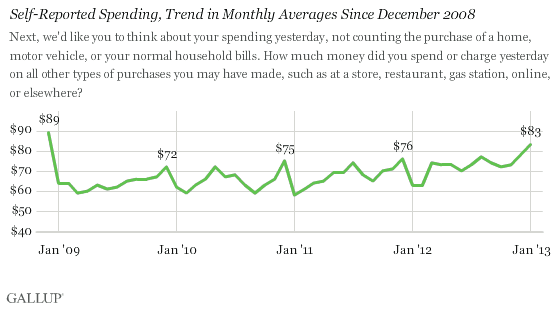
PRINCETON, NJ -- Americans were in a generous mood when it came to spending this past December, as they reported spending an average $83 per day in stores, online, and in restaurants, excluding household bills and a home or car purchase. That is up from $73 in November and the highest monthly figure Gallup has reported since December 2008. It is also the first reading above the $80 mark since the 2008-2009 recession.

The December data are based on Gallup Daily tracking interviews with more than 13,000 U.S. adults conducted throughout the month.
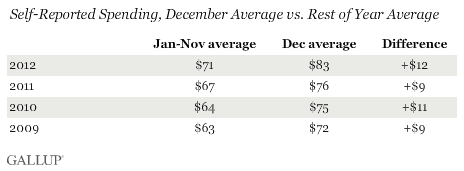
In each of the last four years, December was the single month with the highest spending average, which is not surprising given the tradition of giving and receiving holiday gifts. The December averages are typically about $10 higher than the average of the prior 11 months combined.

The four-year high in spending in December 2012 follows the trend toward increased spending Gallup has observed over the last four years. As the accompanying table shows, both the January through November and December averages have increased each year since 2009.
Spending Up Among Higher- and Lower-Income Americans
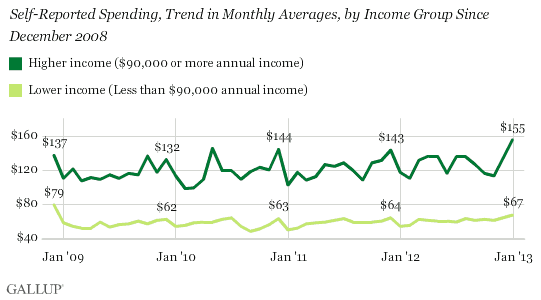
Typically, when Gallup finds variation in month-to-month spending, it is because of changes among the highest income Americans, those whose annual household incomes exceed $90,000. Americans below that income threshold have a more stable level of spending.
However, in December, self-reported spending increased among both income groups. The monthly average reported daily spending of $155 for higher-income Americans and $67 for lower-income Americans is the highest for each in at least four years.

Thus, the increase in spending in December was broad-based, with people of varying economic resources spending at least a bit more than they have in recent memory.
Implications
The increase in Americans' reported spending is clearly a positive sign for the U.S. economy, which is heavily dependent on consumer spending to drive economic growth. Indeed, many retail stores reported strong sales in December after a slower start to the holiday season. And the 2012 holiday season proved to be a strong one for online retailers, something that Gallup's spending estimates would pick up but reports of sales at retail stores would not.
Whether the trend toward greater spending continues in 2013 is unclear. Most Americans are seeing a decrease in take-home pay with the expiration of the Social Security payroll tax holiday, but President Barack Obama's and Congress' efforts to avoid the fiscal cliff kept federal income tax rates the same for most Americans.
Whereas December is usually the strongest month for consumer spending, January is typically one of the weakest, so it is unlikely spending will remain at the higher level reached in December. One key to understanding the trend in consumer spending will be how January 2013 spending compares with prior Januaries. If January 2013 looks strong compared with prior Januaries, it is a sign that the economic momentum is continuing. If it is weaker, it could be a sign that Americans' more generous spending ways may be ending.
Survey Methods
Results are based on telephone interviews conducted as part of the Gallup Daily tracking survey Dec. 1-30, 2012, with a random sample of 13,217 adults, aged 18 and older, living in all 50 U.S. states and the District of Columbia, selected using random-digit-dial sampling.
For results based on the total sample of national adults, one can say with 95% confidence that the maximum margin of sampling error is ±1 percentage points.
The estimates for average daily spending have a margin of sampling error of ±$4.
Interviews are conducted with respondents on landline telephones and cellular phones, with interviews conducted in Spanish for respondents who are primarily Spanish-speaking. Each sample includes a minimum quota of 400 cellphone respondents and 600 landline respondents per 1,000 national adults, with additional minimum quotas among landline respondents by region. Landline telephone numbers are chosen at random among listed telephone numbers. Cellphone numbers are selected using random-digit-dial methods. Landline respondents are chosen at random within each household on the basis of which member had the most recent birthday.
Samples are weighted by gender, age, race, Hispanic ethnicity, education, region, adults in the household, population density, and phone status (cellphone only/landline only/both, cellphone mostly, and having an unlisted landline number). Demographic weighting targets are based on the March 2011 Current Population Survey figures for the aged 18 and older U.S. population. All reported margins of sampling error include the computed design effects for weighting.
In addition to sampling error, question wording and practical difficulties in conducting surveys can introduce error or bias into the findings of public opinion polls.
For more details on Gallup's polling methodology, visit https://www.gallup.com/.
