WASHINGTON, D.C. -- There were only three days in 2012 -- with one being the day of the Newtown school shooting -- when the percentage of Americans who reported experiencing a lot of happiness and enjoyment without a lot of stress and worry dropped below 40%. In comparison, happiness fell below 40% on 14 days in 2008 and 12 days in 2009.

Results for each year are comprised of more than 350,000 surveys, conducted daily as part of the Gallup-Healthways Well-Being Index. As part of the survey, interviewers read respondents a series of emotions and ask them to say whether they experienced each one "during a lot of the day yesterday." The U.S. Mood Index tracks the percentage of Americans who, reflecting on the day before they were surveyed, say they experienced a lot of happiness and enjoyment without a lot of stress and worry, and vice-versa.
On average, 48% reported experiencing a lot of happiness and enjoyment without a lot of stress and worry on any given day in 2012, with a range of 38% on the least happy day to 66% on the happiest day. The percentage of Americans who reported the reverse -- a lot of stress and worry without a lot of happiness and enjoyment -- ranged from 16% on the most stressful days to 4% on the least stressful day.
Americans' levels of happiness or stress can be influenced by a number of factors, including their health, work, family life, specific happy or stressful events that occur in their lives on a given day, and even the day of the week.
A study of Gallup-Healthways U.S. mood data published last year in The Journal of Positive Psychology found that Americans' moods improve considerably on Fridays and then slightly lift on Saturdays and Sundays. Notably, all of the least happy days in 2012 occurred at the start or middle of the workweek, with the exception of Friday, Dec. 14, the day of the school shooting in Newtown, Conn. The Newtown school shooting ranked as the third least happy day of 2012, but Americans' moods bounced back the following day. The low happiness level that coincided with the day of Newtown school massacre may have been moderated by the boost in Americans' moods that occurs on weekends.
Election Day was also one of the least happy and most stressful days last year. Notably, the day following the election, Nov. 7, was also one of the least happy days of 2012. Americans' happiness levels may not have bounced back after Election Day -- as they did after the Newtown school massacre -- because Election Day took place during the workweek.
In both 2012 and 2008, the same percentage of Americans -- 40% -- reported experiencing a lot of happiness on Election Day. However, more Americans reported experiencing a lot of stress and worry on Election Day in 2012 than did on Election Day in 2008 --16% in 2012 vs. 13% in 2008.

Holidays Coincide With Happiest Days in 2012
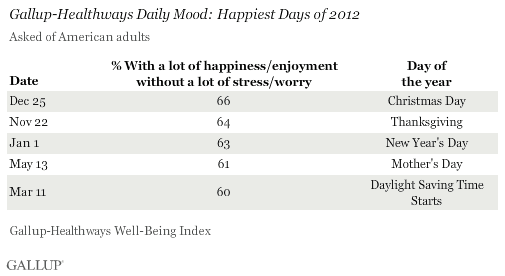
The likely causes of Americans' happiest days are more apparent. As in prior years, in 2012 most of these fell on or close to major holidays. For the second year in a row, Christmas was the happiest day of the year and Thanksgiving was the second happiest day. New Year's Day and Mother's Day were the third and fourth happiest days, respectively.

Americans Slightly Less Happy and Just as Stressed in 2012
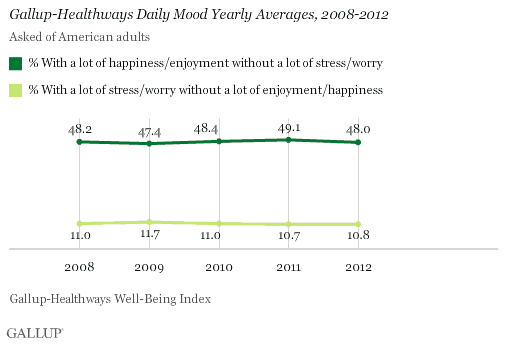
Overall, Americans' self-reports of daily happiness declined slightly in 2012, after improving over the past two years. The percentage of Americans, on average, experiencing a lot of happiness and enjoyment without a lot of stress and worry decreased to 48.0% in 2012 from 49.1% in 2011. The percentage who experienced the opposite -- a lot of stress and worry without a lot of happiness or enjoyment -- remained virtually the same in 2012 as it was in 2011.

Implications
Overall, Americans were slightly less likely, on average, to experience happiness daily in 2012 compared with 2011. Still, in 2012 Americans had significantly fewer days than in 2008 and 2009 when less than 40% reported experiencing a lot of happiness and enjoyment without a lot of stress. Americans were more likely to experience happiness and enjoyment on holidays and less likely to experience happiness following negative news events.
All of the least happy days in 2012 occurred at the beginning or middle of the workweek, with the exception of the day of the Newtown school massacre. Gallup has found that Americans are happiest when they spend six to seven hours socializing each day, which is more likely to happen on weekends and holidays than during the normal workweek. Thus, employers may want to create opportunities for socializing at work to help increase their employees' happiness and reduce their stress levels during the workweek. Doing so may boost employees' social well-being, which could contribute to an increase in their productivity.
About the Gallup-Healthways Well-Being Index
The Gallup-Healthways Well-Being Index tracks well-being in the U.S. and provides best-in-class solutions for a healthier world. To learn more, please visit well-beingindex.com.
Survey Methods
Results are based on annual sample sizes of more than 350,000 surveys per year and on daily sample sizes of at least 1,000 surveys per day.
For annual results based on the total sample of national adults, one can say with 95% confidence that the maximum margin of sampling error is ±0.2 percentage points. For daily results based on the total sample of national adults, one can say with 95% confidence that the maximum margin of sampling error is ±4 percentage points.
Interviews are conducted with respondents on landline telephones and cellular phones, with interviews conducted in Spanish for respondents who are primarily Spanish-speaking. Each sample includes a minimum quota of 400 cellphone respondents and 600 landline respondents per 1,000 national adults, with additional minimum quotas among landline respondents by region. Landline telephone numbers are chosen at random among listed telephone numbers. Cellphone numbers are selected using random-digit-dial methods. Landline respondents are chosen at random within each household on the basis of which member had the most recent birthday.
Samples are weighted by gender, age, race, Hispanic ethnicity, education, region, adults in the household, and phone status (cellphone only/landline only/both, cellphone mostly, and having an unlisted landline number). Demographic weighting targets are based on the March 2011 Current Population Survey figures for the aged 18 and older non-institutionalized population living in U.S. telephone households. All reported margins of sampling error include the computed design effects for weighting and sample design.
In addition to sampling error, question wording and practical difficulties in conducting surveys can introduce error or bias into the findings of public opinion polls.
For more details on Gallup's polling methodology, visit https://www.gallup.com/.
