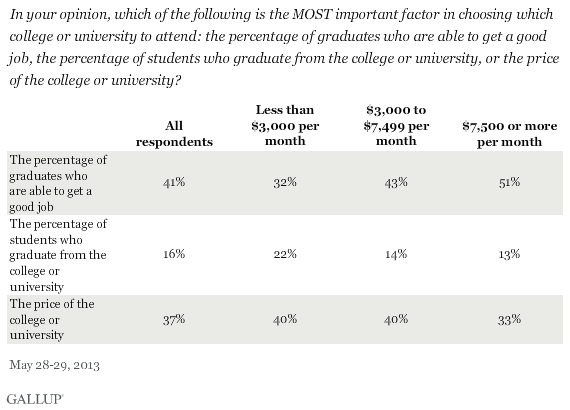
WASHINGTON, D.C. -- Americans are as likely to say the percentage of graduates who are able to get a good job is the most important factor in choosing which college or university to attend as they are to say the price. Far fewer care about the graduation rate.

High-income Americans are more likely than those with lower incomes to say the percentage of graduates who are able to get a good job is the most important factor in college selection. Similarly, those with a college or postgraduate degree are more likely than those with less education to say that the percentage of graduates who are able to get a good job is the most important factor.
These findings are from a Gallup survey conducted May 28-29 on behalf of Lumina Foundation with a random sample of 1,012 adults, aged 18 and older, living in all 50 U.S. states and the District of Columbia.
Majority Says One Year of Tuition Should Be No More Than $20,000
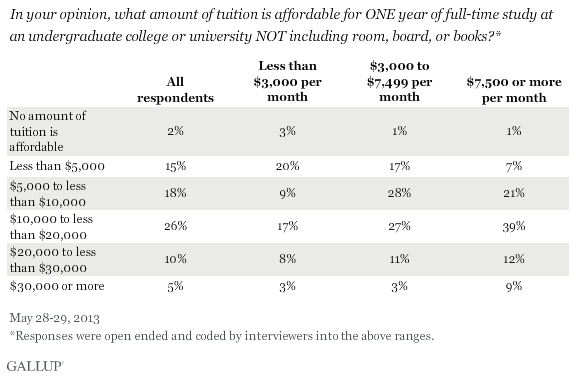
The majority of Americans say one year of college tuition should be no more than $20,000. The most popular price range for one year was $10,000 to less than $20,000, with 26% saying this price range is affordable.
Lower-income Americans are more price sensitive when it comes to the cost of a year of tuition -- 17% in this group says $10,000 to $20,000 a year is affordable. This compares with the 39% of high-income Americans who say that price range is OK.

Those with a college or postgraduate degree are a bit more willing to say $20,000 or more a year is affordable than those with less education.
To Americans, Higher Tuition Doesn't Mean Higher Quality
One in four Americans strongly disagree that the higher the tuition at a college or university, the better the quality of the education. At the other end of the spectrum, 10% strongly agree with this sentiment.

Implications
Americans are interested in understanding the return on investment for higher education. There is some tolerance for the significant cost associated with higher education, but Americans do not tend to see higher cost equating to higher quality.
Beyond cost, Americans care a lot about whether the graduates of a college end up in good jobs, but find it hard to find this type of data. If more data were available, it could help those currently weighing their options to make a quality choice based on likelihood for a strong return in the future.
Read more about Gallup's services for higher education.
Survey Methods
This article presents findings from a brief quantitative survey that Gallup conducted on behalf of Lumina Foundation. The overall objective of the study was to determine the perceptions of the general American population about several important issues pertaining to higher education, including value, cost, and access to information.
Results for this Gallup poll are based on telephone interviews conducted May 28-29, 2013, on the Gallup Daily tracking survey, with a random sample of 1,012 adults, aged 18 and older, living in all 50 U.S. states and the District of Columbia.
For results based on the total sample of national adults, one can say with 95% confidence that the margin of sampling error is ±4 percentage points. For subpopulations within this sample, the margin of error would be greater.
Interviews are conducted with respondents on landline telephones and cellular phones, with interviews conducted in Spanish for respondents who are primarily Spanish-speaking. Each sample includes a minimum quota of 50% cellphone respondents and 50% landline respondents, with additional minimum quotas by region. Landline telephone numbers are chosen at random among listed telephone numbers. Cellphone numbers are selected using random-digit-dial methods. Landline respondents are chosen at random within each household on the basis of which member had the most recent birthday.
Samples are weighted to correct for unequal selection probability, nonresponse, and double coverage of landline and cell users in the two sampling frames. They are also weighted to match the national demographics of gender, age, race, Hispanic ethnicity, education, region, population density, and phone status (cellphone only/landline only/both, cellphone mostly, and having an unlisted landline number). Demographic weighting targets are based on the March 2012 Current Population Survey figures for the aged 18 and older U.S. population. Phone status targets are based on the July-December 2011 National Health Interview Survey. Population density targets are based on the 2010 census. All reported margins of sampling error include the computed design effects for weighting.
In addition to sampling error, question wording and practical difficulties in conducting surveys can introduce error or bias into the findings of public opinion polls.
Polls conducted entirely in two days, such as this one, are subject to additional error or bias not found in polls conducted over several days.
For more details on Gallup's polling methodology, visit www.gallup.com.
