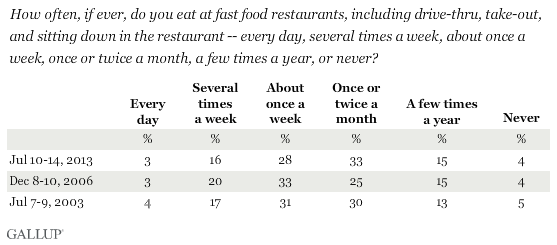
WASHINGTON, D.C. -- Eight in 10 Americans report eating at fast-food restaurants at least monthly, with almost half saying they eat fast food at least weekly. Only 4% say they never eat at fast-food restaurants. But slightly fewer Americans eat fast food weekly now than did so in 2006, when Gallup last asked about it.

These findings come from Gallup's annual Consumption poll, conducted July 10-14, 2013, and seem to suggest that many Americans are reducing, but not totally eliminating, their fast-food intake.
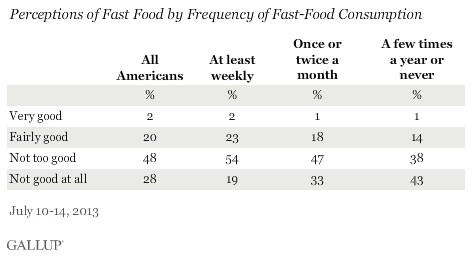
Fast food has long been a staple of many Americans' diets, but widespread concerns related to the nutritional value of the food linger. On that point, 76% in the U.S. think the food served in fast-food restaurants is "not too good" or "not good at all for you," the same percentage who said so in 2003.
Twenty-eight percent say the food is "not good at all for you." Fewer, 20%, believe food purchased at fast-food restaurants is "fairly good for you," while 2% say it is "very good for you."

Young Eat Fast Food Most Often; Low-Income Individuals, the Least
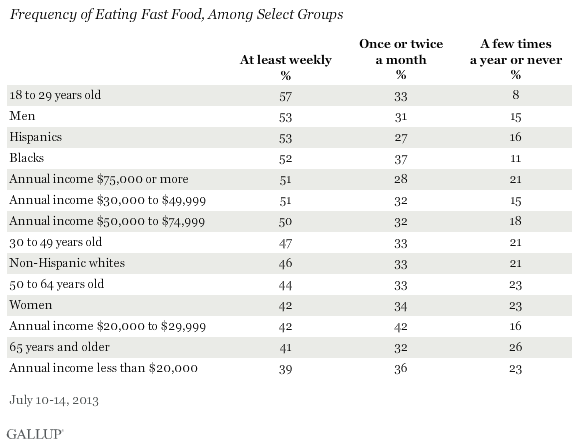
Young adults -- those aged 18 to 29 -- eat fast food most often, with 57% saying they do so at least weekly. Fast-food consumption declines with age; the percentage who say they eat it at least weekly drops to 47% for those aged 30 to 49, 44% for those aged 50 to 64, and 41% among those aged 65 and older.
Men are more likely than women to eat fast food at least weekly -- 53% vs. 42%. Men aged 18 to 49 in particular eat fast food at least weekly, at 57%.
Across racial and ethnic groups, blacks and Hispanics eat fast food most often, with 52% and 53%, respectively, eating it at least weekly. Less than half of non-Hispanic whites (46%) by comparison dine on fast food at least weekly.

Fast food is typically low in cost, which is part of its appeal to many Americans. But fast food is hardly the province solely of those with lower incomes; in fact, wealthier Americans -- those earning $75,000 a year or more -- are more likely to eat it at least weekly (51%) than are lower-income groups. Those earning the least actually are the least likely to eat fast food weekly -- 39% of Americans earning less than $20,000 a year do so.
Most Weekly Fast-Food Eaters Believe the Food Is Not Good for You
More than seven in 10 of those who eat fast food weekly or more frequently believe it is not "good for you." The 25% of this group who believe fast food has some degree of health value is about the same as the 22% of the overall population who believe this.
However, those who eat fast food infrequently are much less likely to say it is "good for you." Nineteen percent of those who eat fast food once or twice a month say it is fairly or very good for you, as do 15% of those who eat it a few times a year or never.

Implications
Undoubtedly, fast-food restaurants still represent a major part of the American dining experience, with almost all Americans eating fast food at least occasionally -- though the percentage who do so frequently is down slightly from seven years ago.
A large swath of the public believes food served at fast-food restaurants is not good for them, and even about three-quarters of weekly fast-food consumers believe this. Nonetheless, a huge share of Americans continue to visit fast-food drive-throughs or dining rooms, suggesting that the appeal of the product -- be it the relatively low cost, the taste, or the convenience -- outweighs the health concerns.
Survey Methods
Results for this Gallup poll are based on telephone interviews conducted July 10-14, 2013, on the Gallup Daily tracking survey, with a random sample of 2,027 adults, aged 18 and older, living in all 50 U.S. states and the District of Columbia.
For results based on the total sample of national adults, one can say with 95% confidence that the margin of sampling error is ±3 percentage points.
Interviews are conducted with respondents on landline telephones and cellular phones, with interviews conducted in Spanish for respondents who are primarily Spanish-speaking. Each sample of national adults includes a minimum quota of 50% cellphone respondents and 50% landline respondents, with additional minimum quotas by region. Landline and cell telephone numbers are selected using random-digit-dial methods. Landline respondents are chosen at random within each household on the basis of which member had the most recent birthday.
Samples are weighted to correct for unequal selection probability, nonresponse, and double coverage of landline and cell users in the two sampling frames. They are also weighted to match the national demographics of gender, age, race, Hispanic ethnicity, education, region, population density, and phone status (cellphone only/landline only/both, and cellphone mostly). Demographic weighting targets are based on the March 2012 Current Population Survey figures for the aged 18 and older U.S. population. Phone status targets are based on the July-December 2011 National Health Interview Survey. Population density targets are based on the 2010 census. All reported margins of sampling error include the computed design effects for weighting.
In addition to sampling error, question wording and practical difficulties in conducting surveys can introduce error or bias into the findings of public opinion polls.
View methodology, full question results, and trend data.
For more details on Gallup's polling methodology, visit www.gallup.com.
