This article is part of an ongoing series analyzing how the government shutdown and the debate over raising the debt ceiling are affecting Americans' views of government, government leaders, political parties, the economy, and the country in general.
PRINCETON, NJ -- Even as the division of power in Washington between Republicans and Democrats is wreaking havoc with the federal government, Americans' preference for having one political party run both the White House and Congress is at a record low.

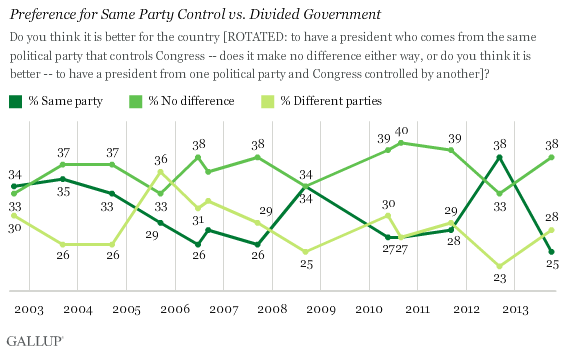
At, 25%, the percentage of Americans today favoring one-party control in Washington is virtually equivalent to the 28% who favor splitting power between the two parties. The plurality, 38%, say it makes no difference.
The latest figures are from an Oct. 3-6 Gallup poll, conducted within the first week of the partial federal government shutdown. The freeze on non-essential services resulted from the failure of President Barack Obama and the Republican-led House of Representatives to agree on the latest continuing resolution needed to fund the government.
Partisans' Views Dictated by the Sitting President's Party
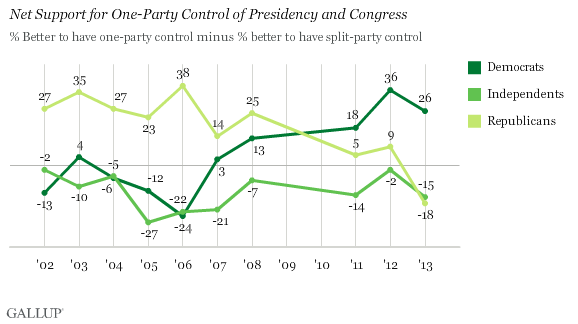
Since Gallup in 2002 started tracking public preferences for party control, Republicans' and Democrats' views have seemed largely dependent on which party controls the presidency, and that holds true today.
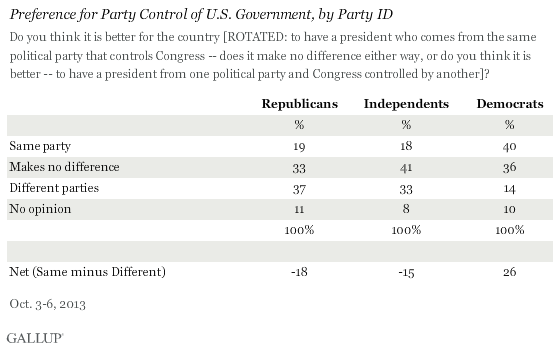
With a Democratic president in office, Democrats currently favor one-party control over divided control by 40% to 14%, with 36% saying it makes no difference. Democrats' resulting +26 net support for single-party control over divided control is down from +36 in 2012 amid the heat of the presidential election campaign, but is still strong relative to their views during Republican George W. Bush's presidency. At that time, from 2002 through 2008, Democrats showed at most a slight preference for single-party power, with their net support for it ranging from -24 to +13.
Republicans, on the other hand, currently believe that having different parties control the presidency and Congress is the better scenario: 19% favor one-party control and 37% favor divided control, with 33% saying it makes no difference. Republicans' -18 net support for one-party control today is a sharp change from 2011 and 2012, when they held a slight preference for one-party control. Republicans showed even higher net support for one-party control across Bush's two terms, ranging from +14 to +38.
Independents are the most likely of the three party groups to say neither scenario is necessarily better for the country, at 41%. However, the remainder currently lean more heavily in favor of divided government than single-party control, 33% vs. 18%, for a net -15. That represents lower support for single-party control than in 2012, but is similar to the average among independents from 2002 through 2011.

See page 2 for a detailed breakdown of 2013 views by party ID.
Bottom Line
One might think that after Americans witnessed this month's spectacular display of political gridlock in Washington, their desire to have one political party control both the presidency and Congress would have surged. But one would be wrong.
Many Americans, regardless of their political affiliation, hold firm to the seemingly cynical view that it doesn't matter how party control is organized in Washington. Beyond that, Republicans' and Democrats' preferences seem mainly influenced by which scenario would be better for their own party, given the affiliation of the sitting president. That leaves the views of non-skeptical independents, who lean roughly 2-to-1 toward divided government -- a typical posture that possibly reflects their fundamental distance from both parties.
This raises questions about how potent the issue of partisan balance will be in the 2014 midterm elections or the 2016 presidential election. Both parties may invoke the shutdown fiasco to try to persuade voters to install a single party -- their party -- both in the White House and on Capitol Hill. However, if Americans aren't currently convinced this is the best scenario for the country, it may be difficult to kindle that belief in one or three years.
Survey Methods
Results for this Gallup poll are based on telephone interviews conducted Oct. 3-6, 2013, with a random sample of 1,028 adults, aged 18 and older, living in all 50 U.S. states and the District of Columbia.
For results based on the total sample of national adults, one can say with 95% confidence that the margin of sampling error is ±4 percentage points.
Interviews are conducted with respondents on landline telephones and cellular phones, with interviews conducted in Spanish for respondents who are primarily Spanish-speaking. Each sample of national adults includes a minimum quota of 50% cellphone respondents and 50% landline respondents, with additional minimum quotas by region. Landline and cell telephone numbers are selected using random-digit-dial methods. Landline respondents are chosen at random within each household on the basis of which member had the most recent birthday.
Samples are weighted to correct for unequal selection probability, nonresponse, and double coverage of landline and cell users in the two sampling frames. They are also weighted to match the national demographics of gender, age, race, Hispanic ethnicity, education, region, population density, and phone status (cellphone only/landline only/both, and cellphone mostly). Demographic weighting targets are based on the March 2012 Current Population Survey figures for the aged 18 and older U.S. population. Phone status targets are based on the July-December 2011 National Health Interview Survey. Population density targets are based on the 2010 census. All reported margins of sampling error include the computed design effects for weighting.
In addition to sampling error, question wording and practical difficulties in conducting surveys can introduce error or bias into the findings of public opinion polls.
View methodology, full question results, and trend data.
For more details on Gallup's polling methodology, visit www.gallup.com.

