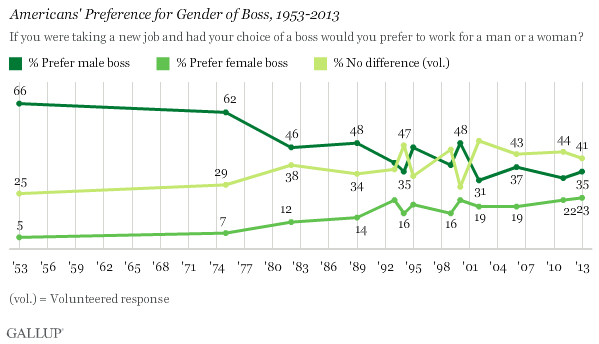
PRINCETON, NJ -- If Americans were taking a new job and had their choice of a boss, they would prefer a male boss over a female boss by 35% to 23%, although four in 10 would have no preference. These attitudes have not changed much in recent years, but when Gallup first asked this question in 1953, 66% of Americans preferred a male boss, while just 5% preferred working for a woman.

These most recent data are from Gallup's annual Work and Education survey, conducted Aug. 7-11, 2013. Gallup asks this question of all Americans, regardless of their employment status or work history; the responses of working Americans and those who are not employed were similar in the most recent survey.
The proportion of Americans who prefer a female boss has increased by 18 percentage points over the past six decades, while there has been a 31-point decline in the percentage who would prefer a male boss. Americans are also significantly more likely today than in 1953 to volunteer that they do not have a preference.
The 23% of Americans who would opt to work for a woman is the highest in the history of Gallup's asking this question since 1953, although it is essentially the same as in several previous surveys.
Preference for Female Boss Higher Among Those Who Currently Work for a Woman
Fewer Americans today say they work for a female boss than a male boss, and this structural aspect of the workplace in turn likely affects their preferences.
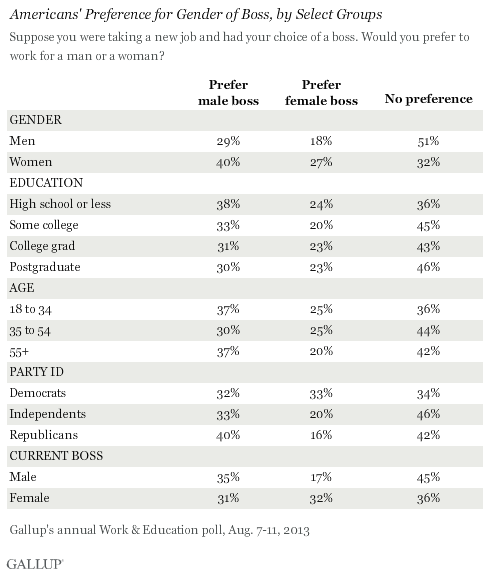
Among working Americans, 54% say they currently work for a man, while 30% work for a woman. Those who currently work for a woman are as likely to prefer having a female boss as a male one. This is one of the few subgroups of the population that does not tilt in the "male boss" direction. Those who currently work for a man prefer a male boss, by 35% to 17%.
It is difficult to establish direction of the relationship between the gender of one's current boss and one's preference for the gender of a boss; it is possible that workers who initially prefer a female boss are more likely to end up in circumstances in which they have a female boss. It is also possible that the experience of working for a female boss affects workers' preferences. If the latter is the case, and if the proportion of U.S. workers who have female bosses increases in the future, the current preference for a male boss in the overall population could dissipate.
Other key differences in preferences for male or female bosses across subgroups include the following:
- Both men and women prefer a male boss. More than half of men say the gender of their boss makes no difference, but those who have a preference favor a male boss by an 11-point margin. Women are more likely than men to have a preference, with higher proportions expressing preferences for each gender of boss, though women choose a male over a female boss by a 13-point margin.
- There are some differences by age, with Americans between 35 and 54 the least likely to prefer a male boss. Younger Americans are generally not more likely than average, or less likely, to prefer a male boss.
- Political partisanship significantly predicts attitudes toward the gender of one's boss, with Democrats essentially breaking even in their preferences, while independents and Republicans prefer a male boss.
- Americans of all education levels prefer a male boss, by margins ranging from seven to 14 percentage points.

Implications
Although four in 10 Americans do not have a preference for a male or a female boss, those who do would rather work for a man than a woman -- as they have since Gallup began asking this question in 1953.
The minority of working Americans who have a female boss break even in their preferences for the gender of their boss, suggesting that if the percentage of Americans who work for a woman increases, so might the percentage who would rather work for a woman. However, young Americans' preferences are in line with the average, which suggests that the aging of today's workforce may not in and of itself produce changes in these attitudes in the years ahead.
Key remaining questions center on the reasons or explanations for people's preference of a male or female boss, particularly relating to workers' experience with male or female bosses -- and what can be learned from those preferences that can be used to maximize worker engagement and foster a more productive work environment. Future Gallup research will look at these issues.
Survey Methods
Results for this Gallup poll are based on telephone interviews conducted Aug. 7-11, 2013, on the annual Gallup Work and Education Survey, with a random sample of 2,059 adults, aged 18 and older, living in all 50 U.S. states and the District of Columbia.
For results based on the total sample of national adults, one can say with 95% confidence that the margin of sampling error is ±3 percentage points.
For results based on the total sample of 1,039 adults employed full or part time, one can say with 95% confidence that the margin of sampling error is ±4 percentage points.
For results based on the total sample of 605 Americans with a male boss, one can say with 95% confidence that the margin of sampling error is ±4 percentage points.
For results based on the total sample of 340 Americans with a female boss, one can say with 95% confidence that the margin of sampling error is ±5 percentage points.
Interviews are conducted with respondents on landline telephones and cellular phones, with interviews conducted in Spanish for respondents who are primarily Spanish-speaking. Each sample of national adults includes a minimum quota of 50% cellphone respondents and 50% landline respondents, with additional minimum quotas by region. Landline and cell telephone numbers are selected using random-digit-dial methods. Landline respondents are chosen at random within each household on the basis of which member had the most recent birthday.
Samples are weighted to correct for unequal selection probability, nonresponse, and double coverage of landline and cell users in the two sampling frames. They are also weighted to match the national demographics of gender, age, race, Hispanic ethnicity, education, region, population density, and phone status (cellphone only/landline only/both, and cellphone mostly). Demographic weighting targets are based on the March 2012 Current Population Survey figures for the aged 18 and older U.S. population. Phone status targets are based on the July-December 2011 National Health Interview Survey. Population density targets are based on the 2010 census. All reported margins of sampling error include the computed design effects for weighting.
In addition to sampling error, question wording and practical difficulties in conducting surveys can introduce error or bias into the findings of public opinion polls.
View methodology, full question results, and trend data.
For more details on Gallup's polling methodology, visit www.gallup.com.
