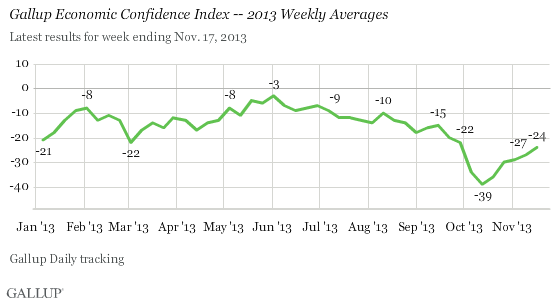
WASHINGTON, D.C. -- Americans' confidence in the economy continued to recover last week after taking a hit during the partial U.S. government shutdown. Gallup's Economic Confidence Index rose to -24, much improved from -39 in mid-October during the shutdown, but it has not yet bounced back to the -15 found in mid-September.

This marks the fifth consecutive week that Americans' confidence has risen. Still, the index remains far below the weekly peak of -3 from late May and early June, and the annual average of -15 so far in 2013. Even with confidence plummeting during the fiscal negotiations in October, the index is still on track to exceed the annual average of -21 for 2012 and be the highest yearly average since Gallup began tracking economic confidence daily in 2008.
Assessments of Current Conditions and Future Outlook Recovering
Gallup's Economic Confidence Index is based on two components: Americans' assessments of current economic conditions in the U.S. and their perceptions of whether the economy is getting better or worse.
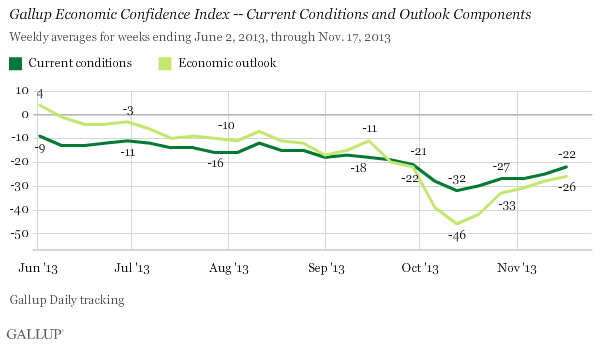
Americans' net economic outlook score was -26 last week, up from -28 the prior week. The current score represents 35% who said the economy is getting better and 61% who said it is getting worse.
Americans' economic outlook score entered positive territory in late May and early June for the first time since Gallup Daily tracking began in January 2008. The public's perception of the economy's direction has generally soured since then and got much worse during the government shutdown. Americans' outlook is on the upswing, though, rising 20 points since mid-October.
Last week's net current conditions score was -22, compared with -25 the prior week. The current score represents 16% of Americans who say the economy is "excellent" or "good," while 38% say it is "poor." Americans' assessments of the current economic situation have improved by 10 points since mid-October, but had not deteriorated as much as their outlook during the shutdown.

Implications
Americans' confidence in the economy continues to inch up after it suffered during the federal shutdown and debt limit negotiations. And although confidence plummeted in October, this year it is on track to be the best it has been in at least six years.
Still, the recent events in Washington shook Americans' economic confidence, which has not yet recovered to where it was. With the all-important holiday shopping season starting next week, it is unclear how the recent changes in confidence will affect Christmas spending. Gallup's October and November estimates of holiday spending were mixed, with the more recent report showing a less optimistic outlook. At times in the past, Americans' holiday spending intentions have picked up as Christmas drew nearer, but that is far from a certainty.
Gallup.com reports results from these indexes in daily, weekly, and monthly averages and in Gallup.com stories. Complete trend data are always available to view and export in the following charts:
Daily: Employment, Economic Confidence, Job Creation, Consumer Spending
Weekly: Employment, Economic Confidence, Job Creation, Consumer Spending
Read more about Gallup's economic measures.
View our economic release schedule.
Survey Methods
Results for this Gallup poll are based on telephone interviews conducted Nov. 11-17, 2013, on the Gallup Daily tracking survey, with a random sample of 3,556 adults, aged 18 and older, and living in all 50 U.S. states and the District of Columbia.
For results based on the total sample of national adults, one can say with 95% confidence that the margin of sampling error is ±3 percentage points.
Interviews are conducted with respondents on landline telephones and cellular phones, with interviews conducted in Spanish for respondents who are primarily Spanish-speaking. Each sample of national adults includes a minimum quota of 50% cellphone respondents and 50% landline respondents, with additional minimum quotas by region. Landline and cell telephone numbers are selected using random-digit-dial methods. Landline respondents are chosen at random within each household on the basis of which member had the most recent birthday.
Samples are weighted to correct for unequal selection probability, nonresponse, and double coverage of landline and cell users in the two sampling frames. They are also weighted to match the national demographics of gender, age, race, Hispanic ethnicity, education, region, population density, and phone status (cellphone only/landline only/both, and cellphone mostly). Demographic weighting targets are based on the March 2012 Current Population Survey figures for the aged 18 and older U.S. population. Phone status targets are based on the July-December 2011 National Health Interview Survey. Population density targets are based on the 2010 census. All reported margins of sampling error include the computed design effects for weighting.
In addition to sampling error, question wording and practical difficulties in conducting surveys can introduce error or bias into the findings of public opinion polls.
For more details on Gallup's polling methodology, visit www.gallup.com.
