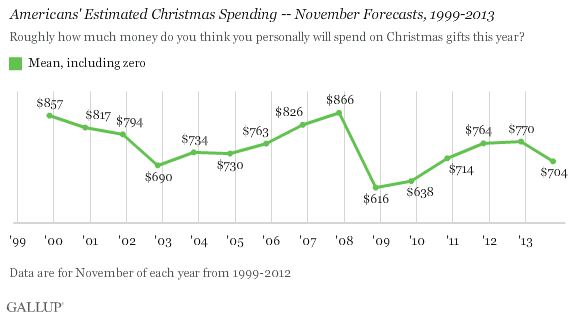
PRINCETON, NJ -- U.S. consumers now estimate they will spend $704 on Christmas gifts this season, down from their $786 average prediction in October. Americans' latest estimate is also significantly below the $770 they forecasted at this time last year -- a particularly worrisome sign for retailers.

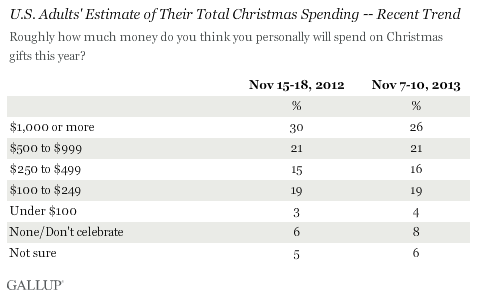
The latest average spending estimate is based on a Nov. 7-10 Gallup poll with 1,039 national adults. About one in four Americans, 26%, say they will spend $1,000 or more on Christmas gifts, down from 30% in November 2012. Accordingly, a somewhat higher percentage this year than last -- 31% vs. 27% -- intends to spend less than $250, including 8% this year who do not intend to purchase Christmas presents.

Gallup's October measure of Americans' holiday spending intentions came in slightly higher than consumers' November 2012 estimate, pointing to a respectable 3.7% to 4.0% increase in holiday retail shopping over 2012. That is roughly what industry reports show occurred last month: In October, retailers tracked by Thomson Reuters reported 3.7% growth, on average, and U.S. chain store sales were up by 4.1%. However, according to Gallup modeling of the trends, consumers' new scaled-back plans for 2013 suggest overall holiday spending -- defined by the National Retail Federation as holiday shopping that occurs in November and December -- now may be relatively anemic, increasing by only 1.7% to 2.4% over 2012.
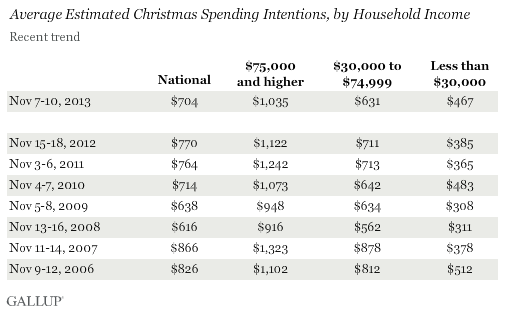
Adults living in upper- and middle-income households have scaled back their Christmas gift-buying plans this year, with the average estimated total spending of those making $75,000 or more down $87, similar to the $80 decrease among those earning between $30,000 and $74,999. Lower-income households spending estimate has increased by $82, to $467.

A Contrary, but Positive, Signal for Holiday Spending
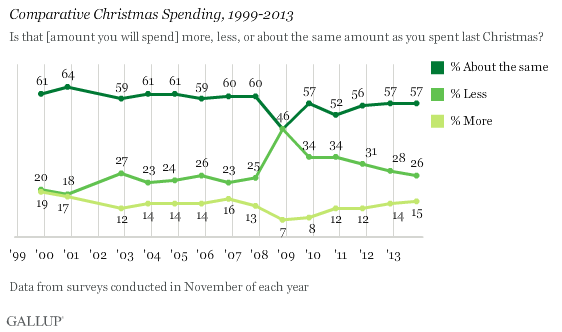
There is an important asterisk on this sober forecast for retailers. Gallup asked Americans a separate question about whether the amount they plan to spend is more, less, or the same as what they spent the previous Christmas, and this self-assessment is slightly more positive today than in November 2012. As is usually the case, the majority of Americans say they will spend about the same on gifts as the year prior. It is thus the balance of those saying they will spend more vs. less that is illuminating.
Twenty-six percent of Americans say they will spend less on gifts this year, slightly below last year's 28%. The percentage saying they will spend more is 15%, on par with 14% last year. The resulting 11-percentage-point difference is one of the narrower gaps in favor of those saying they will spend less that Gallup has seen in recent years and suggests an annual uptick in holiday spending close to 5%.

Bottom Line
Americans have had several momentous economic events to digest and react to these past two months, including budgetary chaos in Washington, administrative turmoil related to the Affordable Care Act, and a relatively weak jobs report in September followed by a better one in October. All the while, the Dow Jones industrial average has been edging closer to the 16,000 mark, and consumers' confidence in the economy has been slowly recovering from the trough it fell into shortly after the government shutdown in early October.
Nevertheless, consumer psychology can be complex, and Americans are now feeling more restrained about holiday shopping than they did a month ago. What looked to be a relatively solid holiday season shaping up for retailers now runs the risk of being a less than merry one.
Consumers' estimates of their Christmas spending often increase between November and December. Consequently, retailers can hope that if this pattern continues, it will be by enough to push spending closer to the 4% increase suggested by Gallup's October holiday spending figure and Americans' current assessment of their relative spending.
Survey Methods
Results for this Gallup poll are based on telephone interviews conducted Nov. 7-10, 2013, with a random sample of 1,039 adults, aged 18 and older, living in all 50 U.S. states and the District of Columbia.
For results based on the total sample of national adults, one can say with 95% confidence that the margin of sampling error is ±4 percentage points.
Interviews are conducted with respondents on landline telephones and cellular phones, with interviews conducted in Spanish for respondents who are primarily Spanish-speaking. Each sample of national adults includes a minimum quota of 50% cellphone respondents and 50% landline respondents, with additional minimum quotas by time zone within region. Landline and cellular telephone numbers are selected using random-digit-dial methods. Landline respondents are chosen at random within each household on the basis of which member had the most recent birthday.
Samples are weighted to correct for unequal selection probability, nonresponse, and double coverage of landline and cell users in the two sampling frames. They are also weighted to match the national demographics of gender, age, race, Hispanic ethnicity, education, region, population density, and phone status (cellphone only/landline only/both, cellphone mostly, and having an unlisted landline number). Demographic weighting targets are based on the March 2012 Current Population Survey figures for the aged 18 and older U.S. population. Phone status targets are based on the July-December 2011 National Health Interview Survey. Population density targets are based on the 2010 census. All reported margins of sampling error include the computed design effects for weighting.
In addition to sampling error, question wording and practical difficulties in conducting surveys can introduce error or bias into the findings of public opinion polls.
View methodology, full question results, and trend data.
For more details on Gallup's polling methodology, visit www.gallup.com.
