WASHINGTON, D.C. -- The percentage of Americans who are "thriving" increased in November to 52.2%, ending a five-month decline. Forty-four percent of Americans rated their lives such that they were considered "struggling" and 4% were "suffering."
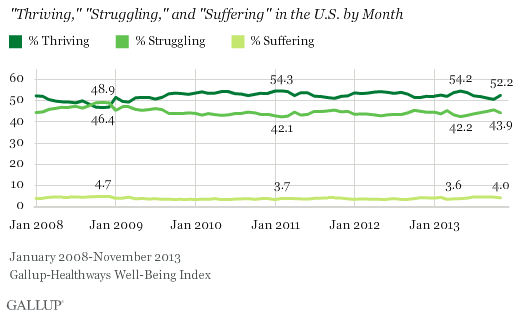
The percentage of Americans who are thriving peaked at 54.2% in May 2013, but then dropped over the next five months. It bottomed out at 50.3% in October, the lowest percentage since early 2009, amid the economic recession.
The decline in September and October in the percentage of Americans who were thriving and improvement in November could be influenced to some degree by Americans' reactions to intense political negotiations in Washington over the federal budget. These events negatively impacted Americans' economic confidence and may have caused a more general sense of negativity that affected life evaluations. The subsequent agreement to end the partial federal government shutdown may have then relieved some of the uncertainty and increased optimism.
Gallup classifies Americans as "thriving," "struggling," or "suffering" according to how they rate their current and future lives on a ladder scale with steps numbered from 0 to 10 based on the Cantril Self-Anchoring Striving Scale. Those who rate their present life a 7 or higher and their life in five years an 8 or higher are classified as thriving, while those who rate both dimensions a 4 or lower are considered suffering. Respondents whose ratings fall in between are considered struggling.
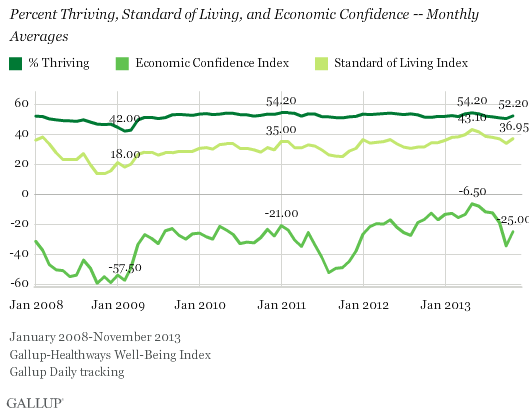
Percentage Thriving Mirrors Economic Confidence and Standard of Living Changes
The uptick in the percentage of thriving Americans between October and November mirrors the positive increases in Americans' economic confidence and standard of living perceptions. Similar to Americans' life ratings, economic confidence and standard of living perceptions plummeted during the federal government shutdown and fiscal negotiations in October and then improved in November.
The percentage of Americans thriving reached a recent high in May, while the Gallup Economic Confidence Index and the Gallup Standard of Living Index also peaked that same month. All three metrics have generally moved in tandem since Gallup Daily tracking began in 2008.
Implications
After a period of economic uncertainty due to the government budgetary debates and resulting shutdown, Americans have become more confident in the economy and more positive about their standard of living -- and at the same time they have become more upbeat about their personal lives.
The Department of Labor released a positive jobs report last Friday, showing that unemployment has declined to 7% in November, from 7.3%, and that 203,000 jobs have been added to the economy. This positive economic news could boost Americans' life evaluations as well as their economic confidence and standard of living perceptions.
Survey Methods
Results are based on telephone interviews conducted as part of the Gallup-Healthways Well-Being Index survey Nov. 1-30, 2013, with a random sample of adults, aged 18 and older, living in all 50 U.S. states and the District of Columbia.
For results based on the total sample of national adults, the margin of sampling error is ±1 percentage points at the 95% confidence level.
Interviews are conducted with respondents on landline telephones and cellular phones, with interviews conducted in Spanish for respondents who are primarily Spanish-speaking. Each sample of national adults includes a minimum quota of 50% cellphone respondents and 50% landline respondents, with additional minimum quotas by region. Landline and cellphone numbers are selected using random-digit-dial methods. Landline respondents are chosen at random within each household on the basis of which member had the most recent birthday.
Samples are weighted to correct for unequal selection probability, nonresponse, and double coverage of landline and cell users in the two sampling frames. They are also weighted to match the national demographics of gender, age, race, Hispanic ethnicity, education, region, population density, and phone status (cellphone only/landline only/both, and cellphone mostly). Demographic weighting targets are based on the March 2012 Current Population Survey figures for the aged 18 and older U.S. population. Phone status targets are based on the July-December 2011 National Health Interview Survey. Population density targets are based on the 2010 census. All reported margins of sampling error include the computed design effects for weighting.
In addition to sampling error, question wording and practical difficulties in conducting surveys can introduce error or bias into the findings of public opinion polls.
For more details on Gallup's polling methodology, visit www.gallup.com.