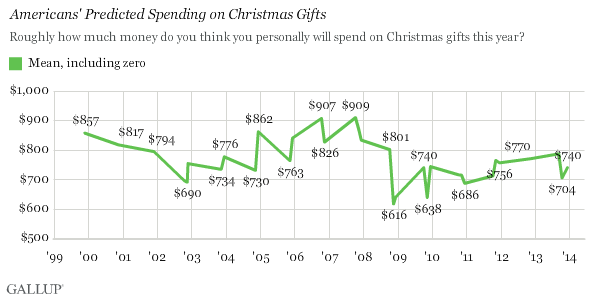
PRINCETON, NJ -- Americans' average prediction for the total amount they will spend on Christmas gifts this season is now $740, midway between the $786 they estimated in October and the $704 in November. Given how the most recent prediction compares with previous years -- coming in below last year's $770 and falling well short of consumers' spending intentions in years prior to the 2008 financial crisis -- the 2013 holiday season will likely be a ho-hum one for retailers.

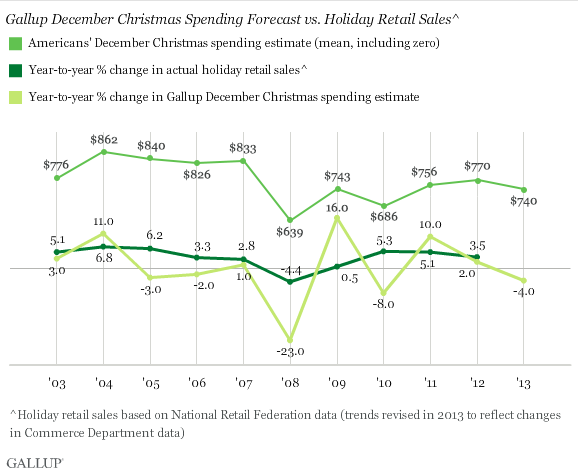
Gallup's modeling of the latest spending estimate, based on a Dec. 5-8 poll, suggests holiday sales will increase between 2.3% and 2.7% this year over 2012. That is just above the 1.7% to 2.4% range Gallup reported last month using the same modeling on consumers' November prediction. Although these levels may seem positive, they are less than the 10-year average increase of 3.3% (as calculated by the National Retail Federation), and below what retailers generally strive for.
Gallup's Christmas spending model is based on a comparison of the annual changes in consumers' Christmas spending intentions since 1999 and the corresponding yearly changes in actual holiday spending, according to statistics compiled by the National Retail Federation.
The historical relationship between Americans' projected Christmas spending and actual holiday sales is not precise. Still, over the past decade, annual changes in Gallup's November and December forecasts have roughly paralleled changes in holiday sales.

Bottom Line
With just weeks left in the 2013 holiday shopping season, Americans, on average, now estimate they will spend $740 on Christmas gifts. That is in between their more positive October estimate and their less positive November estimate. While the December figure does not portend a terrible retail season, the year-over-year increase it suggests -- in the 2.3% to 2.7% range -- would be below par and would clearly indicate that consumers are operating with more of a recessionary mindset than one inspired by the soaring stock market or recent reports of improved economic growth.
Survey Methods
Results for this Gallup poll are based on telephone interviews conducted Dec. 5-8, 2013, with a random sample of 1,031 adults, aged 18 and older, living in all 50 U.S. states and the District of Columbia.
For the mean (including zero) spending level based on the total sample of national adults, the margin of sampling error is ± $54 at the 95% confidence level.
Interviews are conducted with respondents on landline telephones and cellular phones, with interviews conducted in Spanish for respondents who are primarily Spanish-speaking. Each sample of national adults includes a minimum quota of 50% cellphone respondents and 50% landline respondents, with additional minimum quotas by region. Landline and cell telephone numbers are selected using random-digit-dial methods. Landline respondents are chosen at random within each household on the basis of which member had the most recent birthday.
Samples are weighted to correct for unequal selection probability, nonresponse, and double coverage of landline and cell users in the two sampling frames. They are also weighted to match the national demographics of gender, age, race, Hispanic ethnicity, education, region, population density, and phone status (cellphone only/landline only/both, and cellphone mostly). Demographic weighting targets are based on the March 2012 Current Population Survey figures for the aged 18 and older U.S. population. Phone status targets are based on the July-December 2011 National Health Interview Survey. Population density targets are based on the 2010 census. All reported margins of sampling error include the computed design effects for weighting.
In addition to sampling error, question wording and practical difficulties in conducting surveys can introduce error or bias into the findings of public opinion polls.
View methodology, full question results, and trend data.
For more details on Gallup's polling methodology, visit www.gallup.com.
