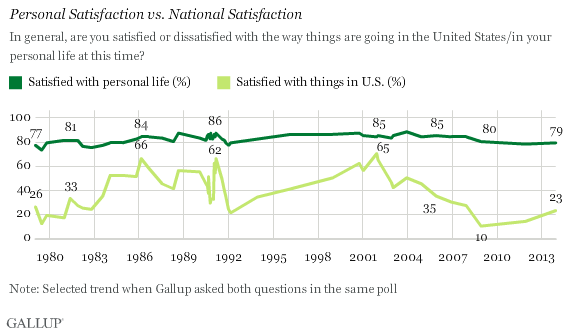
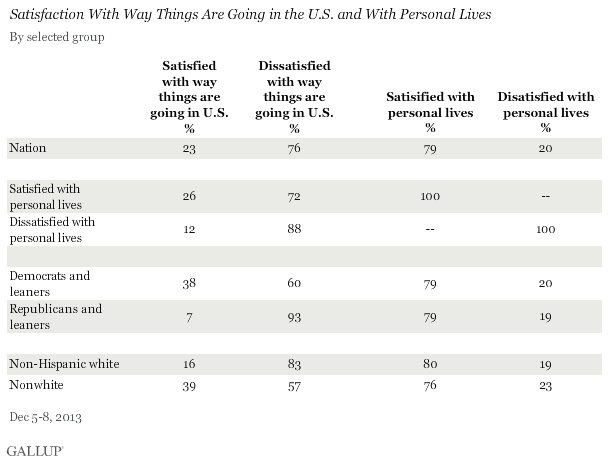
WASHINGTON, D.C. -- Americans remain overwhelmingly satisfied with their personal lives (79%), while far fewer are satisfied with the way things are going in the United States (23%). The 56-percentage-point gap in Americans' satisfaction with personal lives versus the nation is among the highest Gallup has measured over the past 34 years, and may indicate that many do not see the problems facing the country as relevant to their own lives.

In contrast, 76% say they are dissatisfied with the way things are going in the U.S., while one-fifth are dissatisfied about their personal situation.
The results come from a Dec. 5-8 Gallup poll. The nearly one-fourth of Americans who say they are satisfied with how things are going in the U.S. is up slightly from the 2013 nadir of 16% in Gallup's monthly measure, reached during the government shutdown in October. The all-time low on this measure is 7%, registered in October 2008 after the collapse or near collapse of many large financial institutions that set off a global economic panic.
Meanwhile, the percentage of Americans expressing personal satisfaction, which Gallup measures less frequently than national satisfaction, has remained remarkably stable throughout this question's history, though the current reading is down just slightly from the overall average of 82%. When personal satisfaction has fallen below 80%, as is the case now, it has usually been when the U.S. economy is in poorer health, as in the late 1970s and early 1990s.
Although Americans have always been more content with their own lives than with the country's direction, the two have seen an especially large divergence since 2005, as the percentage of Americans saying they are satisfied with the way things are going in the U.S. has declined, while their satisfaction with their personal lives has remained relatively stable. This culminated in a record 70-point gap between the two in December 2008, well into the worst recession since the Great Depression.
Life Satisfaction Important Predictor for National Satisfaction
While no major demographic or political subgroup of the population is predominantly sanguine with the nation at the current juncture, those who are satisfied with their own lives are more likely to be satisfied with the state of the nation (26%) than are Americans dissatisfied with their personal lives (12%).
Additionally, nonwhites are more likely than whites to say they are satisfied with things in the nation; and Democrats are much more likely than Republicans in this regard as well.

Implications
Americans remain amazingly upbeat about their own lives, as they have been for more than three decades. At the same time, satisfaction with the shape of the country in general remains at depressed levels. The last time a majority in Gallup's monthly measurement said they were satisfied with the U.S. was January 2004, and in fact that figure has been no higher than 36% during the course of the Obama presidency.
Indeed the gulf between personal satisfaction and national satisfaction continues to be large by historical standards, and this change since the early 2000s has been driven entirely by the plummeting national satisfaction rating. While an optimist might suggest that the problems facing the country are not so dire that they are worsening the individual lives of the citizenry, as might happen in times of war or national crisis, the implication here is that for most Americans, the nation's woes have little personal impact. Without this individual dimension, voters and the policymakers they elect may feel less inclined to make tough compromises and rally around solutions to serious national concerns -- promoting the type of gridlock that has plagued the nation's capital during the past few years.
Survey Methods
Results for this Gallup poll are based on telephone interviews conducted Dec 5-8, 2013, on the Gallup Daily tracking survey, with a random sample of 1,031 adults, aged 18 and older, living in all 50 U.S. states and the District of Columbia.
For results based on the total sample of national adults, the margin of sampling error is ±4 percentage points at the 95% confidence level.
Interviews are conducted with respondents on landline telephones and cellular phones, with interviews conducted in Spanish for respondents who are primarily Spanish-speaking. Each sample of national adults includes a minimum quota of 50% cellphone respondents and 50% landline respondents, with additional minimum quotas by region. Landline and cell telephone numbers are selected using random-digit-dial methods. Landline respondents are chosen at random within each household on the basis of which member had the most recent birthday.
Samples are weighted to correct for unequal selection probability, nonresponse, and double coverage of landline and cell users in the two sampling frames. They are also weighted to match the national demographics of gender, age, race, Hispanic ethnicity, education, region, population density, and phone status (cellphone only/landline only/both, and cellphone mostly). Demographic weighting targets are based on the March 2012 Current Population Survey figures for the aged 18 and older U.S. population. Phone status targets are based on the July-December 2011 National Health Interview Survey. Population density targets are based on the 2010 census. All reported margins of sampling error include the computed design effects for weighting.
In addition to sampling error, question wording and practical difficulties in conducting surveys can introduce error or bias into the findings of public opinion polls.
View methodology, full question results, and trend data.
For more details on Gallup's polling methodology, visit www.gallup.com.
