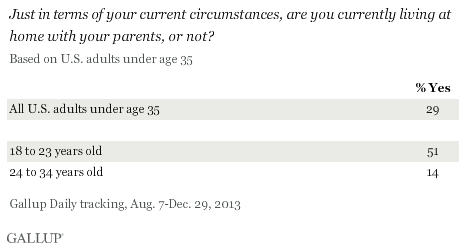
PRINCETON, NJ -- Fourteen percent of adults between the ages of 24 and 34 -- those in the post-college years when most young adults are trying to establish independence -- report living at home with their parents. By contrast, roughly half of 18- to 23-year-olds, many of whom are still finishing their education, are currently living at home.

The results are based on Gallup Daily tracking interviews conducted from Aug. 7 through Dec. 29, 2013, in which adults younger than 35 were asked about their current living arrangements. This article focuses on the 14% who are beyond college age and living at home.
An important milestone in adulthood is establishing independence from one's parents, including finding a job, a place to live and, for most, a spouse or partner, and starting one's own family. However, there are potential roadblocks on the path to independence that may force young adults to live with their parents longer, including a weak job market, the high cost of living, significant college debt, and helping care for an elderly or disabled parent.
A statistical model that takes into account a variety of demographic characteristics indicates that three situational factors are most likely to distinguish the group of 24- to 34-year-olds living at home from their peers:
- They are much less likely to be married.
- They are less likely to be working full time and more likely to be unemployed or underemployed.
- They are less likely to have graduated from college.
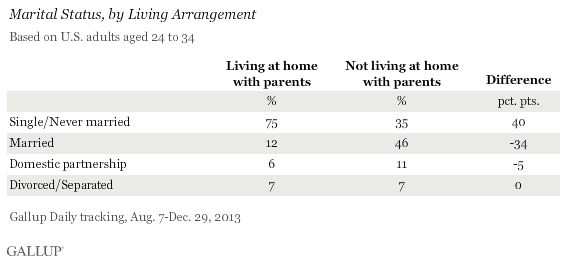
Being married is, by a large margin, the most important predictor of whether individuals between the ages of 24 and 34 live with their parents or have their own place. The vast majority of young adults living at home, 75%, are single and have never married, twice the rate among those of the same ages who are living on their own. A plurality, 46%, of those no longer living with their parents are married.

Divorce or marital separation does not appear to be a major factor in whether young adults move back home, because 7% of both those living and those not living with their parents are divorced or separated. And although the vast majority of those who are living with their parents are currently not married, nearly one in five have added a spouse (12%) or partner (6%) to their parents' household.
Being married may better explain why young adults move out of their parents' home than why single adults live at home. For those living at home, their situation may have more to do with their job or income status than their marital status. Being single, however, may make living with parents a more feasible option for young adults than it would be if they were married.
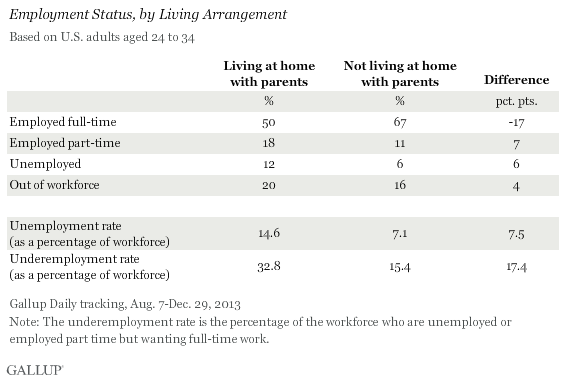
Employment status ranks as the second-most-important predictor of young adults' living situation once they are beyond college age. Specifically, 67% of those living on their own are employed full time, compared with 50% of those living with their parents.

The unemployment rate, as calculated by Gallup, among those in the workforce is twice as high for post-college-aged adults living with their parents as it is for their counterparts who are not living with their parents, 14.6% vs. 7.1%.
The underemployment rate, which combines the percentage unemployed with the percentage working part time but wanting full-time work, is 32.8% among those living at home and 15.4% among those living on their own. In other words, among young adults who live with their parents and are working or actively looking for work, nearly one in three are in a substandard employment situation.
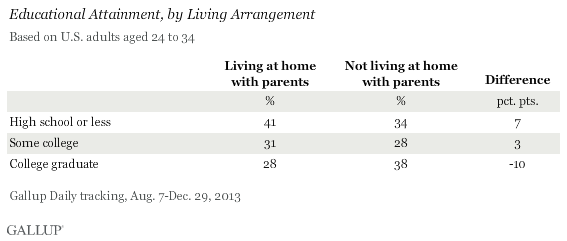
Education is also an important predictor of whether young adults are living at home: those with higher educational attainment are more likely to have their own place to live, and those with less formal education are more likely to be living at home. Still, a substantial number of those living at home, 28%, are college graduates.

Twenty-four- to 34-year-olds living at home do not differ substantially from those of the same age living on their own in terms of gender, race, region, or prior military service.
Implications
A 2012 report from Ohio State University sociologists showed that it is increasingly common for young adults to live at home with their parents. The high costs of housing and a relatively weak job market are key factors that may force, or encourage, young adults to stay at home.
Perhaps it is comforting that by the time U.S. adults pass college age, the vast majority have left their parents' homes and found a place of their own to live. The biggest impetus for leaving home seems to be marriage, easily the strongest predictor of one's living arrangement among those between the ages of 24 and 34. This indicates that if the marriage rate increases in the future, the percentage living with their parents may decline. Earlier Gallup research suggests that most unmarried Americans do have a goal of getting married someday.
Also, those who have secured full-time employment or have earned college degrees are more likely to have gotten a place of their own to live. An improving job market and economy should lead to a decrease in the percentage of young adults living with their parents.
A key question is to what extent those living at home are better off or worse off than their contemporaries who are out on their own, and what implications that has for society in general and the economy in particular. Gallup will explore differences in well-being between young adults living with parents and those living on their own in an upcoming story.
Survey Methods
Results for this Gallup poll are based on telephone interviews conducted Aug. 7-Dec. 29, 2013, on the Gallup Daily tracking survey, with a random sample of 3,445 adults, aged 18-34, living in all 50 U.S. states and the District of Columbia, who report they are currently living at home with their parents.
For results based on the total sample of adults living at home with their parents, the margin of sampling error is ±2 percentage points at the 95% confidence level.
For results based on the total sample of 1,076 adults aged 24-34 who are living at home with their parents, the margin of sampling error is ±4 percentage points at the 95% confidence level.
Interviews are conducted with respondents on landline telephones and cellular phones, with interviews conducted in Spanish for respondents who are primarily Spanish-speaking. Each sample of national adults includes a minimum quota of 50% cellphone respondents and 50% landline respondents, with additional minimum quotas by region. Landline telephone numbers are chosen at random among listed telephone numbers. Cellphone numbers are selected using random-digit-dial methods. Landline respondents are chosen at random within each household on the basis of which member had the most recent birthday.
Samples are weighted to correct for unequal selection probability, nonresponse, and double coverage of landline and cell users in the two sampling frames. They are also weighted to match the national demographics of gender, age, race, Hispanic ethnicity, education, region, population density, and phone status (cellphone only/landline only/both, cellphone mostly, and having an unlisted landline number). Demographic weighting targets are based on the most recent Current Population Survey figures for the aged 18 and older U.S. population. Phone status targets are based on the most recent National Health Interview Survey. Population density targets are based on the most recent U.S. census. All reported margins of sampling error include the computed design effects for weighting.
In addition to sampling error, question wording and practical difficulties in conducting surveys can introduce error or bias into the findings of public opinion polls.
For more details on Gallup's polling methodology, visit www.gallup.com.
