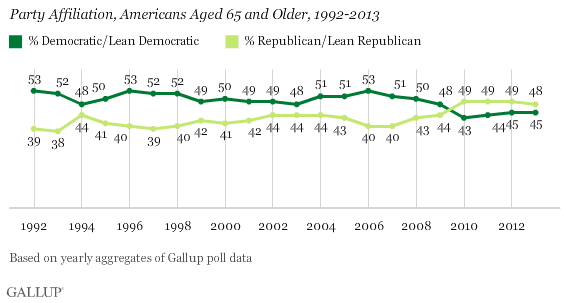
PRINCETON, NJ -- U.S seniors -- those aged 65 and older -- have moved from a reliably Democratic group to a reliably Republican one over the past two decades. From 1992 through 2006, seniors had been solidly Democratic and significantly more Democratic than younger Americans. Over the last seven years, seniors have become less Democratic, and have shown an outright preference for the Republican Party since 2010.

In 1992, 53% of senior citizens, on average, identified as Democrats or said they were independents but leaned Democratic, while 39% identified as Republicans or leaned Republican, resulting in a 14-percentage-point Democratic advantage in seniors' party affiliation. Last year, 48% of seniors identified as or leaned Republican, and 45% Democratic, a three-point Republican advantage. The full 1992-2013 party affiliation trends for seniors and younger Americans are shown on page 2.
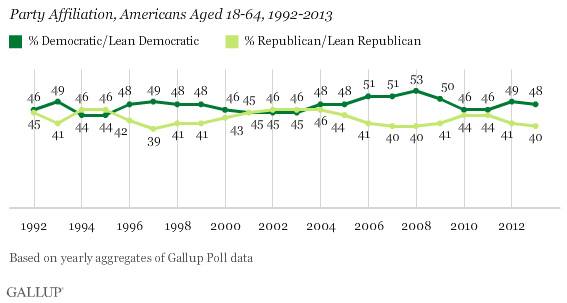
By comparison, younger Americans, those aged 18 to 64, shifted from +1 point Democratic in 1992 to +8 Democratic in 2013, and tended to show greater Democratic advantages from 2006 to 2013 than prior to that. The changes in younger Americans' party affiliation generally follow those among the broader U.S. adult population between 1992 and 2013.
Senior citizens' changing political preferences are also apparent in their recent presidential vote preferences, according to Gallup's final pre-election polls. Senior voters favored the Democratic candidate in each election from 1992 through 2004, including a 17-point margin for Bill Clinton in 1992, the highest among age groups. In each of the last two elections, by contrast, seniors were the only age group to support the Republican candidate over Barack Obama.
Today's Seniors Were Once Democrats
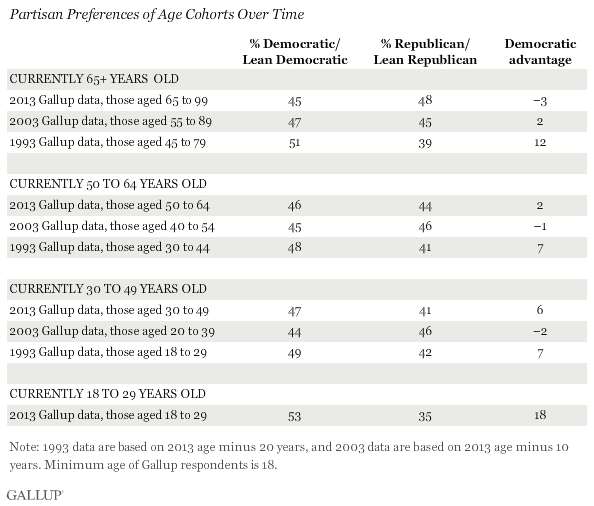
Gallup's analysis reveals that the changes in seniors' party preferences are attributable in part to attitudinal change among today's seniors as they have aged. This is evident in survey results from 1993 and 2003 that show the party preferences of today's seniors when they were 10 or 20 years younger.
In 1993, Americans then aged 45 to 79 represented the age group that today is 65 to 99. At that time, 20 years ago, those 45 to 79 were highly Democratic, with a 12-point advantage in favor of the Democrats. That gap was larger than the average seven-point Democratic advantage among younger age groups that year.
Ten years later, all age cohorts had become more Republican and were fairly balanced politically. Today's seniors, who were aged 55 to 89 in 2003, were the only age cohort to tilt Democratic at that time. The 2013 results show that today's seniors have continued to move in a Republican direction, while the younger age cohorts have gone back in a Democratic direction.

Race a Factor in Seniors' Shifting Allegiances
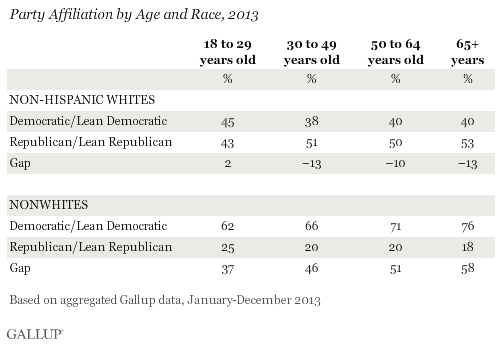
U.S. party preferences are strongly polarized along racial lines, and one reason seniors are more Republican now is that they are racially distinct from other age groups. Eighty-five percent of those 65 and older are non-Hispanic whites, according to Gallup estimates, compared with 77% of 50- to 64-year-olds, 66% of 30- to 49-year-olds, and 54% of 18- to 29-year-olds.
Whites 18 to 29 are slightly Democratic, but whites in all older age groups lean Republican by 10- to 13-point margins. At the same time, nonwhites in all age groups are overwhelmingly Democratic. Nonwhite seniors, in fact, are the most strongly Democratic of any age group.

The mainly white racial composition of seniors has not changed much in recent years, whereas younger age groups have become increasingly diverse. In 1995, the first year Gallup routinely measured both race and Hispanic ethnicity, 89% of seniors were non-Hispanic white, four points higher than today. But other age groups are now substantially more diverse than in 1995, showing declines of between nine and 17 points in the percentage of the group that is non-Hispanic white.
An earlier Gallup analysis showed that whites have become more firmly aligned with the Republican Party in recent years. Because seniors are predominantly white, the "Republicanization" of whites is more evident among this group.
However, white seniors have not always been as Republican as younger whites. From 1995 until 2008, whites aged 65 and older averaged a three-point greater preference for the Democratic Party than the Republican Party. In contrast, all other age groups of whites showed predominantly Republican preferences during those years.
Implications
It is not uncommon for subgroups to show variation in their party preferences over periods of time, usually in response to the political events of the day, such as the Republican surge after the 9/11 terrorist attacks or the Democratic surge in the latter years of the Bush administration.
But when change becomes more sustained and lasting, it is a sign of a political realignment. Although those are rare events, there have been some examples in recent decades, such as regional realignments in party preferences among Southerners and New Englanders. Now it appears U.S. seniors may be undergoing a realignment of their own.
Race appears to be a significant factor in seniors' Republican realignment, because whites have become more solidly Republican in recent years, seniors are overwhelmingly white, and white seniors today are Republican-aligned, while white seniors in the past were Democratic-aligned.
The timing of the shift raises the possibility that it is motivated by recent events that have more closely linked race and political party than was the case in the past, including the mid-2000s debate over immigration, and the election and presidency of Barack Obama. Because seniors did not show an outright preference for the Republican Party until 2010, Obama's second year in office, it may not have been just Obama's race per se, but his policies and performance in office that has turned seniors "red."
Once Obama leaves office, his influence on party preferences among racial and age groups may become clearer, if he is succeeded by a white president from either party. Should the current trends in party preference by age persist, it suggests a political realignment among seniors has taken place. If the current trends by age shift in the other direction, it suggests the shift was temporary, likely tied to the Obama era.
Survey Methods
Results are based on yearly aggregated data from multiple day Gallup telephone polls conducted between 1995 and 2013. Each yearly aggregate is based on a minimum of 18,000 interviews with adults age 18 and older.
For results based on the total sample of national adults in any given year, the margin of sampling error is ±1 percentage point at the 95% confidence level.
For results based on the total sample of Americans age 65 and older in any given year, the margin of sampling error is ±1 percentage point at the 95% confidence level.


