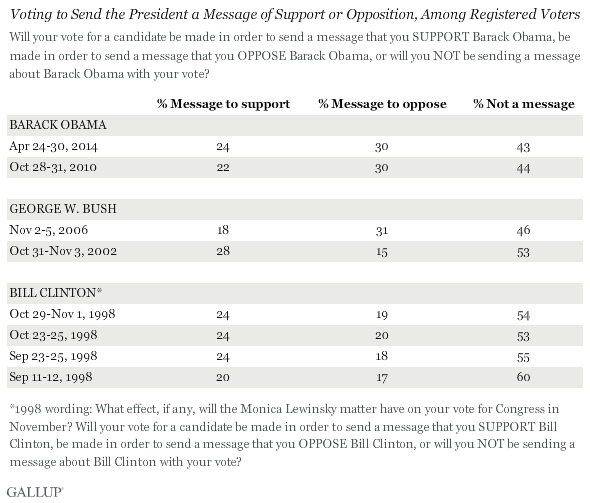
WASHINGTON, D.C. -- Three in 10 registered voters say when they vote for a candidate in the fall midterm elections, it will be to send a message that they oppose U.S. President Barack Obama, equal to the amount who said this before the Republican wave election of 2010. Nearly a quarter, 24%, say they are voting to support Obama, also similar to 2010. The largest number of voters, however, say their vote will not be a reflection on the president.

These results come from an April 24-30 Gallup poll. With various election primaries concluding, such as in North Carolina this past Tuesday, the 2014 midterm campaigns are intensifying. Many political analysts agree that the battle for control of the Senate will be the main element of suspense in the forthcoming election, and President Obama's middling poll numbers will present a challenge to Democratic candidates. Obama himself joked about this at the White House Correspondents' Association Dinner, saying his daughter Sasha "needed a speaker at career day and she invited Bill Clinton."
Obama does appear to be playing more of a role in voters' decisions at the ballot box than was the case for George W. Bush or Bill Clinton during their respective presidencies. A majority (54%) of voters say they will vote to send a message of support (24%) or opposition (30%) to the president, whereas less than a majority said that about either Bush or Clinton.
More voters say they are casting their ballot to oppose Obama than support Obama -- a difference that is similar to Obama's first midterm election in 2010 and President Bush's 2006 midterm election. In both cases, the incumbent president had an approval rating below 50% at the time of the contest, much like Obama's approval rating today.
In October 2010, those voting to oppose President Obama, then in his first term and enjoying Democratic majorities in both chambers of Congress, was eight percentage points higher than those who said they were voting to support the president. Obama's late October approval rating was 45%. The election ended in a Republican rout that hampered the president's ability to enact his agenda, after two years of ambitious, albeit controversial, legislation.
Likewise, in November 2006, more voters said they were voting to oppose (31%) the second-term President Bush than support him (18%). This gap was reflected in the final election results, with Democrats taking back both chambers of Congress for the first time since 1994.
By contrast, years where more voters say they are voting to support the president than oppose him have been marked by congressional gains for the president's party. Just prior to 2002 midterms, 28% of voters said they were voting to support the then-popular Bush as opposed to 15% who were voting to oppose him. That year, Republicans won the midterm elections, reclaiming the Senate and strengthening their House majority.
In 1998, the sixth year of Clinton's presidency, more voters said they were voting to support him than not. In addition, Clinton enjoyed a strong approval rating. Democrats picked up a few House seats that year, bucking the historical trend that typically dooms the party of a second-term president.
More Than Six in 10 Republicans Voting to Oppose President Obama
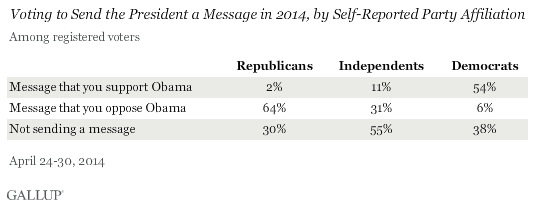
President Obama prominently figures in to the message self-identified Republican voters are trying to send. More than six in 10 Republicans (64%) say their vote will be a message of opposition to the president. This is on par with the situation in November 2010, illustrating that Republican resistance to the president is as strong today as it was before that pivotal election.

A majority of self-identified Democrats (54%) say they will be voting to support the president, which is about where it was in 2010. This also indicates one of Obama's problems: Only slightly more than half of Democrats are motivated to vote in support of him, while almost two-thirds of Republicans are willing to vote against him. More independents say they will vote to oppose the president (31%) than to support him (11%).
Implications
President Obama recently said he has run his "last campaign," but that does not mean he will not have a considerable presence -- for good or ill -- in at least one more election.
Of course, it is early in the 2014 election cycle. Senate Democrats are hopeful that legislation their members introduced, such as increasing the minimum wage and taking action on climate change issues, will ignite popular support for Democratic candidates. Republicans, meanwhile, see reason that their support could widen -- and Obama's popularity diminish -- especially with regard to the healthcare law. And, of course, both sides will closely watch the economy's progress. If economic growth increases, Obama and Democrats could benefit, if not, their electoral prospects could worsen.
Survey Methods
Results for this Gallup poll are based on telephone interviews conducted April 24-30, 2014, on the Gallup Daily tracking survey, with a random sample of 1,336 registered voters, aged 18 and older, living in all 50 U.S. states and the District of Columbia.
For results based on the total sample of registered voters, the margin of sampling error is ±3 percentage points at the 95% confidence level.
Interviews are conducted with respondents on landline telephones and cellular phones, with interviews conducted in Spanish for respondents who are primarily Spanish-speaking. Each sample of national adults includes a minimum quota of 50% cellphone respondents and 50% landline respondents, with additional minimum quotas by time zone within region. Landline and cellular telephone numbers are selected using random-digit-dial methods. Landline respondents are chosen at random within each household on the basis of which member had the most recent birthday.
Samples are weighted to correct for unequal selection probability, nonresponse, and double coverage of landline and cell users in the two sampling frames. They are also weighted to match the national demographics of gender, age, race, Hispanic ethnicity, education, region, population density, and phone status (cellphone only/landline only/both, and cellphone mostly). Demographic weighting targets are based on the most recent Current Population Survey figures for the aged 18 and older U.S. population. Phone status targets are based on the most recent National Health Interview Survey. Population density targets are based on the most recent U.S. census. All reported margins of sampling error include the computed design effects for weighting.
In addition to sampling error, question wording and practical difficulties in conducting surveys can introduce error or bias into the findings of public opinion polls.
View survey methodology, complete question responses, and trends.
For more details on Gallup's polling methodology, visit www.gallup.com.
