Story Highlights
- October index reading dips three points from September
- Index remains among highest scores in six-year trend
- Federal government hiring at highest since 2010
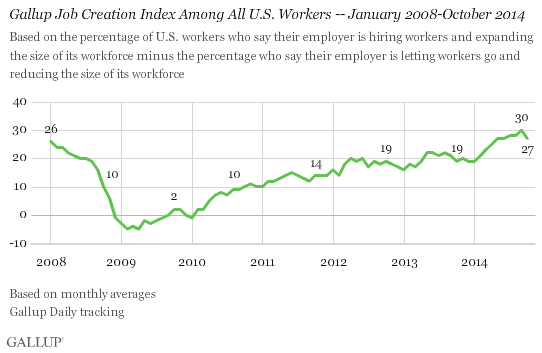
WASHINGTON, D.C. -- Gallup's U.S. Job Creation Index averaged +27 in October, down from the record high in the six-year trend of +30 in September. Despite the decrease, the index remains on the high end of what it has been since 2008.
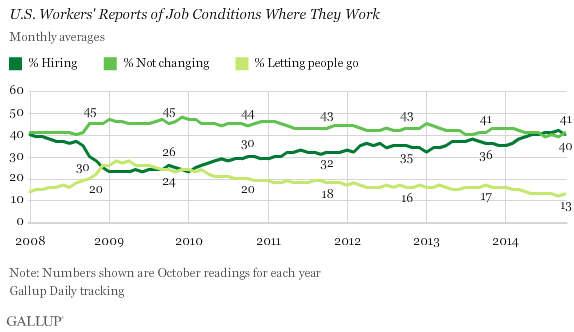
Gallup's Job Creation Index is a measure of net hiring activity in the U.S., with the October average based on a nationally representative sample of more than 17,000 full- and part-time workers. October's +27 index score is based on 40% of employees saying their employer is hiring workers and expanding the size of its workforce -- a small dip from September -- and 13% saying their employer is letting workers go and reducing the size of its workforce. Forty-one percent reported no changes in staffing, an increase from 39% in September.
Through September, the Job Creation Index this year had shown improvement on a month-to-month basis in how Americans perceive job creation in their own places of employment. While the percentage who said their employers were letting people go declined slightly over the year, the percentage saying their employers were hiring ticked upward. The proportion who saw no change in their employer's hiring conditions waned slightly in the first half of 2014 and has now ticked up again in October.
Nongovernment Hiring Dips Three Index Points
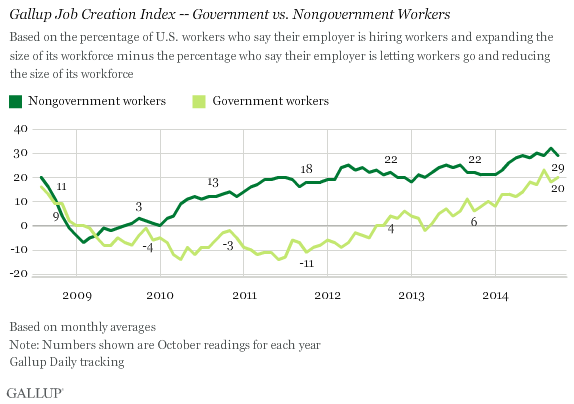
Among government employees, net hiring picked up slightly, to a score of +20 for October. This is one of the highest scores for government job creation since Gallup began tracking the index in 2008.
Meanwhile, nongovernment workers' reports of hiring at their places of work were less positive in October, at +29 -- down from a record high of +32 in September. October's score is still one of the highest figures Gallup has found for nongovernment employees since 2008. Because most of the country's workforce is not in the government sector, the dip in the overall index is largely attributable to perceptions of a slowdown in nongovernment net hiring.
Federal Government Hiring at Highest Since 2010
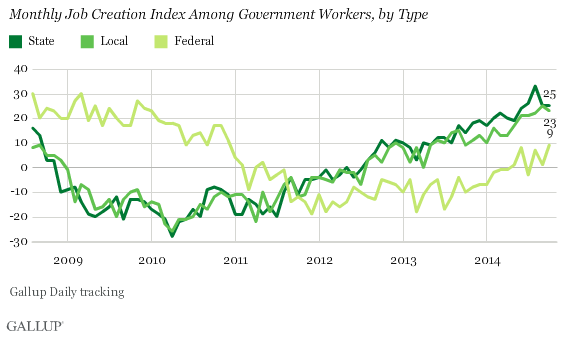
Americans who work for state (+25) or local (+23) governments continue to report a much better hiring situation where they work than those working for the federal government (+9). But federal government hiring has generally picked up this year compared with where it has been in prior years, although with recent month-to-month variations. The current +9 is, by one point, the highest seen since 2010.
Job Creation Strongest in Midwest
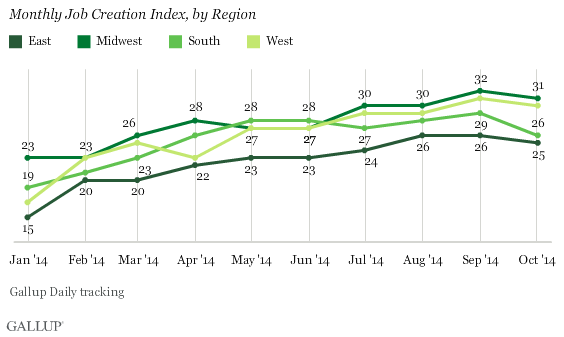
For the past four months, net hiring has been highest in the Midwest, which registered an index of +31 in October. The West, meanwhile, held at +30.
The South saw a drop of three index points, to +26. The East, with a score of +25 for October, has ranked at the bottom of the regions throughout 2014.
Bottom Line
Given the upward climb of the Job Creation Index through the first nine months of 2014, October's small dip in net hiring is not necessarily bad news. More telling will be the figures for November and December, which will indicate if hiring has plateaued or if there is indeed more good news to come in 2014 for the American job market as the holiday hiring season begins.
Americans are more positive in their views of the national economy now than they have been at any point in the past year. This, paired with comparatively high job creation scores -- provided both measures continue their upward trek -- could mean a favorable start to 2015.
Survey Methods
Results for this Gallup poll are based on telephone interviews conducted Oct. 1-31, 2014, on the Gallup U.S. Daily survey, with a random sample of 17,236 adults, aged 18 and older, employed full or part time, living in all 50 U.S. states and the District of Columbia.
For results based on the total sample of working adults, the margin of sampling error is ±1 percentage point at the 95% confidence level.
Each sample of national adults includes a minimum quota of 50% cellphone respondents and 50% landline respondents, with additional minimum quotas by time zone within region. Landline and cellular telephone numbers are selected using random-digit-dial methods.
Learn more about how Gallup Daily tracking works.

