Story Highlights
- Average 45.9% approval similar to 46.1% in prior quarter
- Obama has been under 50% approval for most of his presidency
- Approval midrange compared with other presidents' 27th quarters
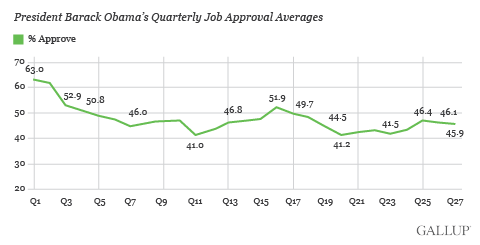
PRINCETON, N.J. -- President Barack Obama's job approval rating in his 27th quarter in office, from July 20 to Oct. 19, averaged 45.9%, essentially unchanged from his 46.1% average for the prior quarter.

Obama's daily approval ratings also varied little within his most recent quarter, averaging 46% nearly every week during the quarter. There were just two modest but notable exceptions. In late August, as U.S. stocks fell in response to concerns about problems in the Chinese economy, his weekly approval rating dipped to 44%. And in late September it rose to 48% during the week of Pope Francis' U.S. trip, which included a widely covered visit with Obama at the White House.
Since he became president nearly seven years ago, Obama has averaged 47% job approval. There have been only five quarters when he had majority approval, with four of those occurring during the first year of his presidency, the so-called "honeymoon phase" when new presidents tend to be rated positively. The only other time Obama's quarterly approval exceeded 50% was perhaps the most consequential one -- the 16th quarter, in which he was re-elected.
Obama's 27th Quarter Midrange Compared With Other Presidents
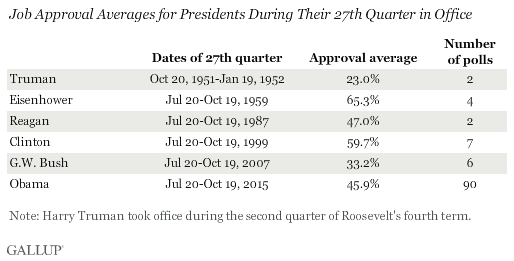
Obama is the sixth post-World War II president to serve a 27th quarter in office. Two of these -- Dwight Eisenhower and Bill Clinton -- were rated quite positively at this stage in their presidencies, with average approval ratings of 65.3% and 59.7%, respectively.
In contrast, Harry Truman (23.0%) and George W. Bush (33.2%) were decidedly unpopular at the same point of their presidencies. Truman's 27th quarter average is the worst quarterly average for any president in Gallup's polling history.
Obama's 27th quarter average, along with Ronald Reagan's, is between these two extremes. Reagan averaged 47.0% approval, slightly better than Obama's 45.9%.

After presidents have served nearly seven years in office, Americans' opinions of them are pretty well-established and unlikely to change unless a major international or domestic crisis occurs. Clinton's and Bush's approval ratings did not change between their 27th and 28th quarters. Truman, Eisenhower and Reagan saw modest improvements of a few percentage points.
Implications
Americans' opinions of Obama have been steady this year, holding near 46%. If his approval ratings do not improve dramatically during the remainder of his presidency, his full-term approval rating average, currently 47%, will rank among the lowest for post-World War II presidents, tied with Gerald Ford's and better than only Truman's (45.4%) and Jimmy Carter's (45.5%).
Obama's relatively low approval ratings may be as much a function of the era in which he is governing as it is a reflection on his leadership, management and decision-making. There have been relatively few international crises that helped to boost his public support, as the 9/11 attacks and Iraq War did for Bush, and as similar crises have done for other presidents. Arguably the only "rally event" in Obama's presidency was the capture of Osama bin Laden. Obama also took office during the Great Recession, and the economic recovery since it ended has been slow and uneven.
But Obama is also governing in a time of extreme partisan polarization. In Congress, that has meant political gridlock since Democrats lost control of the U.S. House in the 2010 midterm elections. In the American public, it is evident in his historically low support from the opposition party. Obama's average 13% approval rating among Republicans is on pace to be the lowest job approval rating from the opposition party by a full 10 percentage points, behind Bush's average 23% approval rating among Democrats. By comparison, Clinton averaged 27% approval among Republicans, and presidents before Clinton averaged 40% approval from the opposition.
These data are available in Gallup Analytics.
Survey Methods
Results for this Gallup poll are based on telephone interviews conducted July 20-Oct. 19, 2015, on the Gallup U.S. Daily survey, with a random sample of 45,663 adults, aged 18 and older, living in all 50 U.S. states and the District of Columbia. For results based on the total sample of national adults, the margin of sampling error is ±1 percentage point at the 95% confidence level. All reported margins of sampling error include computed design effects for weighting.
Each sample of national adults includes a minimum quota of 50% cellphone respondents and 50% landline respondents, with additional minimum quotas by time zone within region. Landline and cellular telephone numbers are selected using random-digit-dial methods.
Learn more about how the Gallup U.S. Daily works.

