Story Highlights
- Significantly improved from year-six average of 42.6%
- His post-State of the Union ratings have been better
- Low approval from Republicans has held his average down
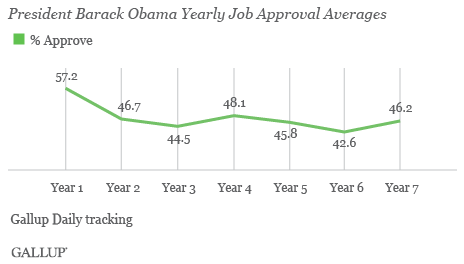
PRINCETON, N.J. -- Throughout his seventh full year in office, beginning Jan. 20, 2015, and ending on Tuesday, President Barack Obama averaged a 46.2% job approval rating. That marks a significant improvement from his 42.6% average during his sixth year in office, the lowest of his presidency to date. His first year (57.2%) remains his best and is the only year in which his approval consistently exceeded 50%.
Better economic news, particularly the low gas prices in the earlier part of the year, aided Obama's seventh-year ratings. Americans' economic confidence in 2015 was higher than in any other year of Obama's presidency. And though the year brought an increased focus on terrorism with the Paris and San Bernardino, California, attacks late in the year, there was arguably less tension on the international stage for the U.S. than during the prior year.
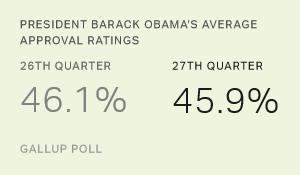
Obama's recent ratings, particularly those Gallup has measured since his Jan. 12 State of the Union address, have been higher than the 46% he averaged throughout his entire seventh year. This includes a 51% approval rating in Jan. 15-17 Gallup Daily tracking. His most recent daily approval rating, based on Jan. 17-19 interviewing, is 48%. Those higher ratings helped push the average approval for his most recent quarter in office -- his 28th, spanning Oct. 20 to Jan. 19 -- up to 46.6%.
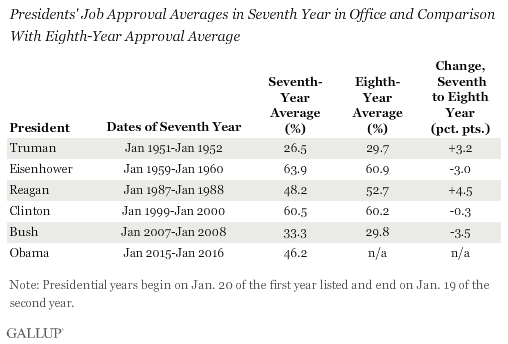
Obama's Seventh Year Matches Historical Average
Obama's seventh-year average approval rating essentially matches the 46.5% average approval rating in year seven for the other five presidents who served that long. Of course, some presidents were significantly above the average in their seventh year in office, including Dwight Eisenhower (63.9%) and Bill Clinton (60.5%), and some were considerably below it, namely, Harry Truman (26.5%) and George W. Bush (33.3%).
Now entering his final year in office, the focus of political attention will surely be on the race to succeed Obama rather than on Obama himself. Historically, there has been no clear pattern in how two-term presidents' approval ratings have changed in their final year in office. Two presidents -- Truman and Ronald Reagan -- saw significant improvements, although Truman's eighth-year average of 29% still rates as one of the worst yearly averages in Gallup's polling history. Two others -- Eisenhower and Bush -- saw declines, although Eisenhower still had a strong 61% approval rating his final year, while Bush's was low at 30%. Clinton's job approval was generally stable his final year in office.
Obama on Pace for One of Lowest Average Approval Ratings
Obama has averaged 47.3% job approval during his presidency to date. Without substantial improvement during his final year in office, his full-term approval average will rank near the bottom of the list for post-World War II presidents, along with Truman (45.4%), Jimmy Carter (45.5%) and Gerald Ford (47.2%).
One factor working against Obama was governing when the U.S. economy struggled to emerge from the Great Recession. There have also been few "rally" events during his presidency, apart from the 2011 killing of Osama bin Laden. These are usually international events that lead to an increase in support for the president. A third factor handicapping Obama is being president in an era of intense partisanship. While presidents' approval ratings have always been higher from supporters of their own party than from supporters of the opposition, the gap between these ratings has risen to new extremes under Obama.
Since Obama has been in office, he has averaged 13% job approval among Republicans. Recent presidents' approval ratings have been significantly better among supporters of the opposing party, including for George W. Bush (average 23% approval from Democrats), Clinton (average 27% approval from Republicans), George H.W. Bush (average 44% approval from Democrats), and Reagan (average 31% approval from Democrats). All of those presidents, including Obama, averaged between 82% and 84% approval from supporters of their own party while president.
To further illustrate the degree that partisanship now affects the way Americans evaluate presidents, the party gaps in approval ratings of Obama are more than twice as large as they were for Carter and Ford, even though these three presidents had similar overall approval ratings.
Carter's average 45.5% job approval rating included average approval ratings of 30% among Republicans but a relatively weak 57% approval from his fellow Democrats. Ford's average 47.2% approval included a 37% average among Democrats and 68% among Republicans. The 27-point gap in party ratings for Carter and the 31-point gap for Ford compare with the 71-point party gap for Obama.
Implications
Obama's seventh year in office was better than his sixth year, at least based on his average job approval ratings. His approval ratings have consistently been below the historical average of 53% based on Gallup polling since 1945. The major exception is Obama's first year in office when he enjoyed a relatively strong "honeymoon" phase.
A weak economy, intense partisanship, the lack of major rally events and public reaction to Obama's actions and policies as president have kept his job approval ratings below average. It seems likely that Obama's full-term average approval rating will rank among the lowest of post-World War II presidents. However, he can still end his term on a strong note, and, as was the case for Reagan and other presidents, his popularity at the time he leaves office may matter more in how Americans view his presidency in retrospect than his overall average approval rating while in office.
These data are available in Gallup Analytics.
Survey Methods
Results for this Gallup poll are based on telephone interviews conducted Jan. 20, 2015-Jan. 19, 2016, on the Gallup U.S. Daily survey, with a random sample of 177,964 adults, aged 18 and older, living in all 50 U.S. states and the District of Columbia. For results based on the total sample of national adults, the margin of sampling error is ±1 percentage point at the 95% confidence level. All reported margins of sampling error include computed design effects for weighting.
Each sample of national adults includes a minimum quota of 60% cellphone respondents and 40% landline respondents, with additional minimum quotas by time zone within region. Landline and cellular telephone numbers are selected using random-digit-dial methods.
Learn more about how Gallup Daily tracking works.