Story Highlights
- Gasoline spending fluctuating sharply since August 2014
- Americans spending more on groceries, less on consumer electronics
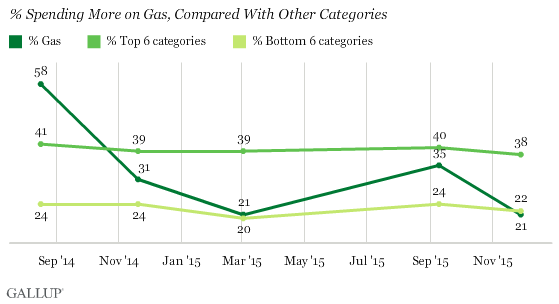
PRINCETON, N.J. -- Americans' reports of changes in their spending in most categories have remained stable in the final quarter of 2015, though spending on gasoline has shown dramatic swings both up and down since June 2014.

Spending categories included in the survey, in addition to gas, can be distilled into two main groups -- Top 6 and Bottom 6 -- based on the percentage of Americans saying they are "spending more compared to one year ago." In September, 35% of Americans said they were spending more on gas, compared with 58% one year earlier. But at the end of 2015, that number went back down to 21%, exactly where it was nine months earlier. It is likely that this swing reflects the reduced demand brought on by the end of the summer driving season, the global oil glut and reduced prices at the pump. Just 37% said they were spending less on gas in November 2014, compared with 55% the following February. Currently, 49% say they are spending less on gas. The net change in spending on gas (the percentage spending more minus the percentage spending less) has swung from -6 in November 2014, to -34 in February, to +4 in September, to -29 in the most recent survey.
Spending on Groceries Continues to Rise
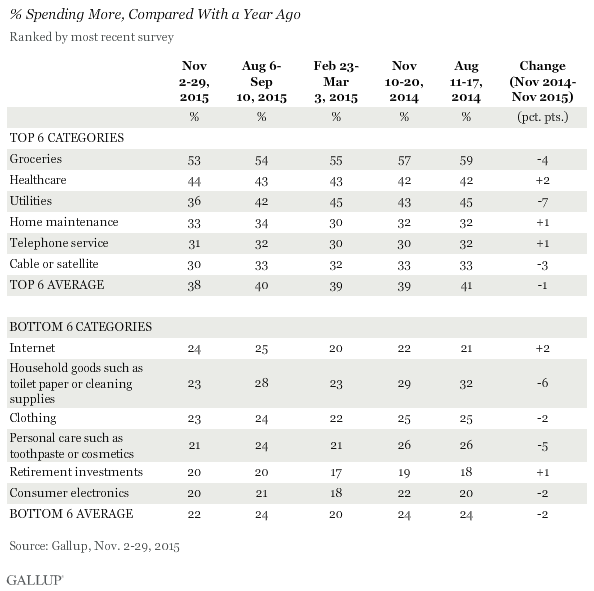
As winter continues, a majority, 53%, still say they are spending more than last year on groceries -- the one specific area in which Americans are most likely to report increased spending. In fact, for most of the spending categories included in the survey, the percentage reporting a spending increase compared with last year has remained fairly stable, varying only within a narrow four- to five-percentage-point range.
Across six separate updates since June 2014, the three categories with the highest percentages of consumers saying they are "spending more compared to a year ago" -- groceries, utilities and healthcare -- have remained at the top of each survey. In the current survey, utilities, groceries, and cable or satellite showed significant declines in the percentage of Americans saying they are spending more (net changes of -7, -4 and -3, respectively) while healthcare increased slightly. Home maintenance and telephone service both stayed flat.

Discretionary Spending Takes a Hit
Another key takeaway is that Americans continue to spend more on things they need, but not on things they want. Retirement investments, leisure activities, clothing, consumer electronics, dining out and travel continue to have negative net spending scores with substantially more Americans saying they are spending less rather than more than last year in these categories. In the September survey, there were some signs that discretionary spending was making a modest comeback. However, reports of changes in discretionary spending fell back again in November. Net spending change on travel (-7), leisure activities (-7) and consumer electronics (-5) have become significantly more negative, driven by increases in the percentage of Americans saying they are spending less on those things and an increase in the percentage of Americans saying they are spending more. It appears that the discretionary spending changes seen in the fall were seasonal -- perhaps attributable to the summer travel season -- rather than more permanent. The same pattern emerged for the travel, leisure activities and gas categories in 2014.
Implications
After more than a year of following Americans' self-reported spending patterns, several conclusions seem worth reinforcing. First, net changes in spending -- the percentage of Americans reporting that they are spending more within a category minus the percentage saying they are spending less -- seem to be fairly stable for all categories, except for gas or fuel. This could be partly attributable to the possibility that self-reports of spending may be less sensitive to actual spending fluctuations than to dramatic shifts in spending, such as the change in spending on gasoline. People may simply be inclined to overlook smaller spending changes in their self-reports. Conversely, people may interpret stable prices following a big slide as a sort of increase, adjusting their self-reports to reflect this. However, another possibility is that, when asked about spending on "groceries," Americans automatically say they are spending more, not because they are spending more, but because they are spending a lot on groceries. It may well be that it is difficult for people to compute an actual spending trend over time, so people may default to just saying they are spending more. This doesn't negate the value of the trends on this measure, but it does suggest that people's estimates of changes in personal spending are more complex than the literal meaning of the question.
Second, the overall order of the spending categories, based on the percentage of people spending more or net spending, hasn't changed very much since Gallup began measuring spending in this way. Three of the top four net spending categories back in June 2014 -- groceries, utilities and healthcare -- all remain at the top. And four of the bottom five net spending categories remain at the bottom -- travel, dining out, consumer electronics and clothing. It is possible that the higher percentages of Americans reporting that they are spending less on these categories reflect an aspirational self-perception -- "I'm thrifty and don't waste money" -- especially when reporting on discretionary purchase categories.


