Story Highlights
- November average same as October average
- Slightly below November spending in 2014, but higher than in 2008-2012
- Spending estimates are generally higher in December than November
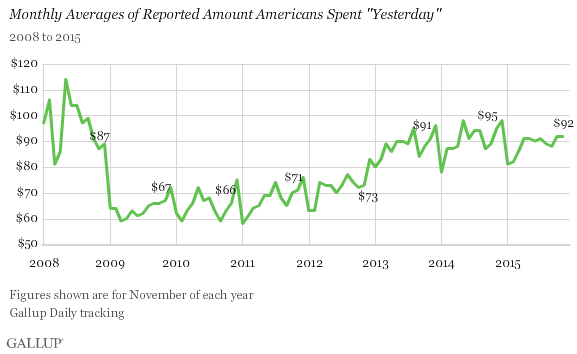
WASHINGTON, D.C. -- Americans' daily self-reports of spending averaged $92 in November. This is the same as the October average, and remains slightly higher than the other monthly averages to date in 2015.

Each day, Gallup asks Americans how much they spent "yesterday" in restaurants, gas stations, stores or online -- not counting home, vehicle or other major purchases, or normal monthly bills -- to provide an indication of Americans' discretionary spending. The November 2015 average of $92 is based on interviews with more than 14,000 U.S. adults.

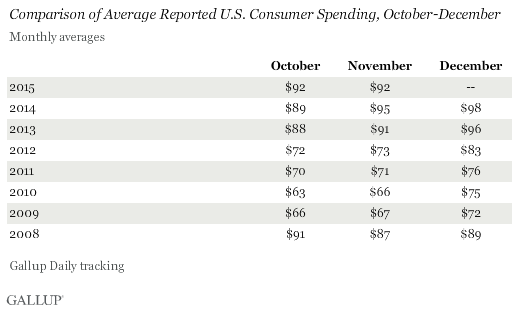
While the November 2015 spending average is slightly below the $95 found in November 2014, it is similar to the $91 in November 2013. Other November averages since 2008 have been lower, between $66 and $87.
Gallup found that average daily spending increased significantly this year during the last few days of November and on Black Friday specifically. This spending increase could be a good sign as the U.S. enters the December holiday shopping period. Historically, spending increases by about $5 between November and December, although smaller increases were seen in 2008 and 2014.

In 2010, 2013 and 2014, spending increased from October to November, but it was stable or even decreased slightly in all other years. Last year, there was a large increase, $6, from October to November, but then a smaller one, $3, from November to December. Other than 2015, 2012 was the most recent year when spending was level between October and November. That same year saw a $10 jump between November and December, the largest jump Gallup has found between these two months.
Bottom Line
Strong, consistent spending in November is a good sign for December spending. Consumer spending generally sees a boost as the year draws to a close, as a result of holiday shopping. And strong December spending is important to the health of the U.S. economy, because spending accounts for about two-thirds of the U.S. gross domestic product.
These data are available in Gallup Analytics.
Survey Methods
Results for this Gallup poll are based on telephone interviews conducted Nov. 1-30, 2015, on the Gallup U.S. Daily survey, with a random sample of 14,212 adults, aged 18 and older, living in all 50 U.S. states and the District of Columbia. For results based on the total sample of national adults, the margin of sampling error is ±1 percentage point at the 95% confidence level. The margin of error for the spending mean is ±$4. All reported margins of sampling error include computed design effects for weighting.
Each sample of national adults includes a minimum quota of 60% cellphone respondents and 40% landline respondents, with additional minimum quotas by time zone within region. Landline and cellular telephone numbers are selected using random-digit-dial methods.
Learn more about how the Gallup U.S. Daily works.

