Story Highlights
- 30% have a favorable impression of Russia, 65% unfavorable
- Younger Americans give highest ratings
- 39% say Russia's military power is a critical threat to the U.S.
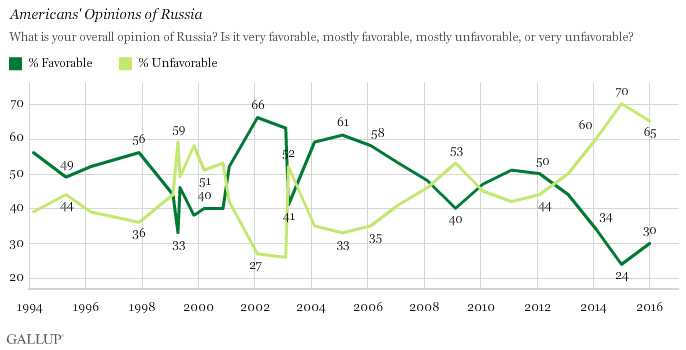
WASHINGTON, D.C. -- After reaching a new low in 2015, Americans' impressions of Russia have recovered somewhat this year, with 30% viewing the country favorably versus 24% in 2015. The majority of Americans continue to view the nation unfavorably, and their favorability rating is still half as high as it was a decade ago.

Russia and the U.S. have a tempestuous history. As part of the Soviet Union, the Russian government engendered fear and resentment among Americans for decades after World War II during the Cold War. Hostilities began to ease during the era of glasnost in the mid-1980s. Through much of the 1990s and 2000s, Americans' favorable opinions of Russia climbed, swelling to 66% in 2002. This sentiment began to crash when Vladimir Putin returned to the presidency in 2012. Some of his policies and actions, including discriminatory policies against gays and Russia's involvement in Ukraine, contributed to favorability dropping to a low point of 24% last year.
But in Gallup's annual World Affairs update survey conducted Feb. 3-7, Americans' favorability toward Russia has edged back up. The reason for this may be that Russia simply isn't dominating news headlines as it did in 2013 and 2014. Putin's interventions in the Middle East and Ukraine have arguably been most in the news in the past year, while Russia has also been prominent for its economic free fall as oil prices collapsed worldwide. The economic free fall, however, may not inspire a negative or positive response in Americans.
Younger Americans Have Highest Favorable Opinion Toward Russia
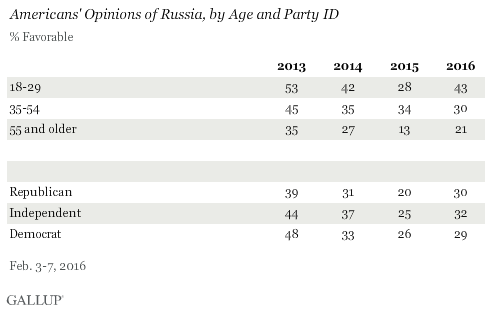
Americans between the ages of 18 and 34 gave Russia the highest favorable rating across all age groups at 43%. This is significantly higher than those aged 35 to 54, and more than double the percentage of Americans aged 55 and older. In the past four years, young Americans have maintained a relatively positive opinion of Russia, with the exception of last year. This may be attributable to most of this age group not living through the Cold War and not viewing Russia as the enemy to the U.S. that other generations experienced.

In the political spectrum, favorability of Russia is similarly low across party lines, with Republicans, Democrats and political independents all giving Russia a favorable rating between 29% and 32%.
Perceptions of Russia's Military Power as a Critical Threat Decline
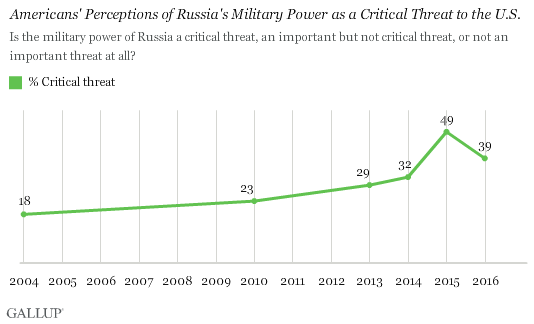
As Americans' opinions of Russia improve, a smaller percentage believes Russia's military power is a critical threat to the U.S. Thirty-nine percent of Americans say Russia's military power is a critical threat, down 10 percentage points from last year, but still above where it was from 2004 through 2014.
Nearly two years since Crimea became part of Russia, stirring up a hornet's nest of geopolitical tension in Eastern Europe, many of the concerns voiced by NATO countries have not materialized. Russia has not invaded other former Soviet republics or made any pronouncements of aggression toward the U.S. Americans' perception of the military power of Russia as a critical threat comes in far below the threats that Americans are most concerned about, including international terrorism and cyberterrorism.

Bottom Line
Russia's image has become slightly less negative this year among U.S. adults, although it remains near the lowest level Gallup has recorded. After a period of several years that Putin has expressed criticism of the U.S., harbored alleged cyberterrorist Edward Snowden, restricted gay rights in his country and annexed Crimea, Americans do not have the same positive feelings toward Russia than in the halcyon period following the end of the Cold War. It will be interesting to see if the next president reaches out to Putin, potentially boosting the favorable ratings of Russia in the U.S.
Historical data are available in Gallup Analytics.
Survey Methods
Results for this Gallup poll are based on telephone interviews conducted Feb. 3-7, 2016, on the Gallup U.S. Daily survey, with a random sample of 1,021 adults, aged 18 and older, living in all 50 U.S. states and the District of Columbia. For results based on the total sample of national adults, the margin of sampling error is ±4 percentage points at the 95% confidence level. All reported margins of sampling error include computed design effects for weighting.
Each sample of national adults includes a minimum quota of 60% cellphone respondents and 40% landline respondents, with additional minimum quotas by time zone within region. Landline and cellular telephone numbers are selected using random-digit-dial methods.
View survey methodology, complete question responses and trends.
Learn more about how Gallup Poll Social Series works.


