Story Highlights
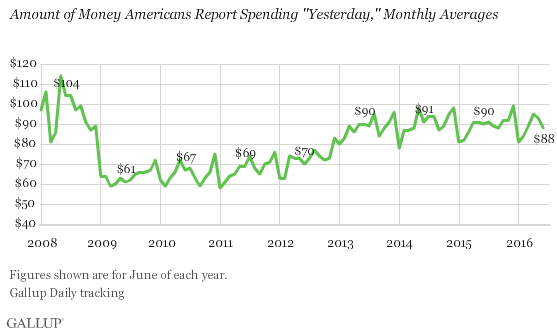
- Daily self-reports of spending averaged $88 in June
- Down from $93 in May and $95 in April
- June spending typically the same as or lower than May's
PRINCETON, N.J. -- Americans' daily self-reports of spending averaged $88 in June, a retreat from the higher levels recorded in April ($95) and May ($93).

These results are based on Gallup Daily tracking interviews conducted throughout June. Gallup asks Americans each night to report how much they spent "yesterday," excluding normal household bills and major purchases such as a home or car. The measure gives an indication of discretionary spending.
Americans' spending in June started out strong, with U.S. adults' estimates of their spending averaging $95 from June 1 through June 15 -- essentially in line with spending in April and May. But consumers appeared to pull back significantly in the second half of the month, with daily reports of spending averaging a much lower $82. Gallup did not observe meaningful differences in first-half versus second-half spending estimates in May or in any prior June.
Although the precise relationship between consumers' evaluations of the economy and their personal spending is unclear, Gallup's Economic Confidence Index also fell slightly in the second half of June compared with where it was in the first half. That decline was apparent prior to Britons' voting to leave the European Union, a move that sent financial markets around the world tumbling. U.S. stocks have since recovered most of the losses.
One possible explanation for the later June spending swoon is that consumers were curtailing their expenditures in anticipation of the July Fourth holiday. The average spending estimate for the first three days of July -- data not reported in the figures for June -- was $112. That is substantially higher than any prior July 1-3 estimate, which range from a low of $68 in 2009 to a high of $97 in 2008. Last year, the average for July 1-3 was $89.
June Spending Typically Similar to or Lower Than May's
There is nothing unusual about June's average spending level failing to match May's. In the nine years Gallup has asked its daily spending measure, the June average has yet to exceed the May average. This year's May-to-June drop, in fact, is similar to the average decline of $4 since 2008.
| May | June | Change | |||||||||||||||||||||||||||||||||||||||||||||||||||||||||||||||||||||||||||||||||||||||||||||||||
|---|---|---|---|---|---|---|---|---|---|---|---|---|---|---|---|---|---|---|---|---|---|---|---|---|---|---|---|---|---|---|---|---|---|---|---|---|---|---|---|---|---|---|---|---|---|---|---|---|---|---|---|---|---|---|---|---|---|---|---|---|---|---|---|---|---|---|---|---|---|---|---|---|---|---|---|---|---|---|---|---|---|---|---|---|---|---|---|---|---|---|---|---|---|---|---|---|---|---|---|
| $ | $ | $ | |||||||||||||||||||||||||||||||||||||||||||||||||||||||||||||||||||||||||||||||||||||||||||||||||
| 2016 | 93 | 88 | -5 | ||||||||||||||||||||||||||||||||||||||||||||||||||||||||||||||||||||||||||||||||||||||||||||||||
| 2015 | 91 | 90 | -1 | ||||||||||||||||||||||||||||||||||||||||||||||||||||||||||||||||||||||||||||||||||||||||||||||||
| 2014 | 98 | 91 | -7 | ||||||||||||||||||||||||||||||||||||||||||||||||||||||||||||||||||||||||||||||||||||||||||||||||
| 2013 | 90 | 90 | 0 | ||||||||||||||||||||||||||||||||||||||||||||||||||||||||||||||||||||||||||||||||||||||||||||||||
| 2012 | 73 | 70 | -3 | ||||||||||||||||||||||||||||||||||||||||||||||||||||||||||||||||||||||||||||||||||||||||||||||||
| 2011 | 69 | 69 | 0 | ||||||||||||||||||||||||||||||||||||||||||||||||||||||||||||||||||||||||||||||||||||||||||||||||
| 2010 | 72 | 67 | -5 | ||||||||||||||||||||||||||||||||||||||||||||||||||||||||||||||||||||||||||||||||||||||||||||||||
| 2009 | 63 | 61 | -2 | ||||||||||||||||||||||||||||||||||||||||||||||||||||||||||||||||||||||||||||||||||||||||||||||||
| 2008 | 114 | 104 | -10 | ||||||||||||||||||||||||||||||||||||||||||||||||||||||||||||||||||||||||||||||||||||||||||||||||
| Gallup Daily tracking | |||||||||||||||||||||||||||||||||||||||||||||||||||||||||||||||||||||||||||||||||||||||||||||||||||
Implications
Gallup's healthy April and May spending estimates were consistent with subsequent Department of Commerce reports of strong retail spending. And June was off to a solid start before consumers appeared to pull back significantly in the second half of the month. The reasons for that pullback are not entirely clear, but the late-month drop is not typical of normal spending patterns.
What is typical, however, is that Gallup's June spending reports usually fail to match those for May. From that perspective, the most recent June numbers are not necessarily disappointing, but the second-half drop does indicate June could have been a much stronger month than it ended up being.
Looking ahead, Gallup's July spending estimates are usually similar to those from June. In most cases, the July figure is slightly higher than June's -- but not to a meaningful degree, with an average increase of $2 since 2008.
That said, this month is off to an auspicious start, with consumer reports of spending this past holiday weekend the best Gallup has measured for the first three days of July in any of the past nine years, and indicates that the late June pullback in spending was likely temporary.
These data are available in Gallup Analytics.
Survey Methods
Results for this Gallup poll are based on telephone interviews conducted June 1-30, 2016, on the Gallup U.S. Daily survey, with a random sample of 15,233 adults, aged 18 and older, living in all 50 U.S. states and the District of Columbia. For results based on the total sample of national adults, the margin of error for the spending mean is ±$4 at the 95% confidence level. All reported margins of sampling error include computed design effects for weighting.
Each sample of national adults includes a minimum quota of 60% cellphone respondents and 40% landline respondents, with additional minimum quotas by time zone within region. Landline and cellular telephone numbers are selected using random-digit-dial methods.
Learn more about how the Gallup U.S. Daily works.


