Story Highlights
- Down from 83% in 2000 and 73% in 2007
- Less than half of young adults say problem is "very serious"
- One-third say drugs are a serious problem in their local area
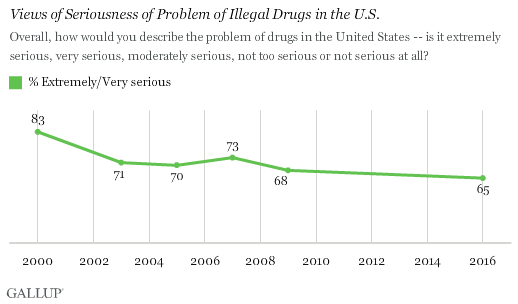
PRINCETON, N.J. -- Sixty-five percent of Americans describe the problem of illegal drugs in the U.S. as "extremely" or "very serious." Although still well above the majority level, the percentage is down significantly from 83% in 2000 and 73% in 2007.

The results are based on Gallup's annual Crime poll, conducted Oct. 5-9. The U.S. has long struggled with problems coming from the sale and use of illegal drugs, such as drug-related crime and drug addiction.
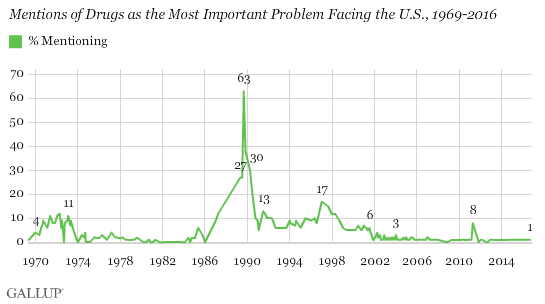
Americans have frequently mentioned drugs as the most important problem facing the country in the past. It ranked as the No. 1 problem on the list from May 1989 through April 1990, including September 1989 when a high of 63% mentioned it. That poll was conducted shortly after President George H.W. Bush gave a nationally televised address to outline his anti-drug strategy in an attempt to fight the crack cocaine epidemic and the international threat posed by Colombian drug lords.

From 1970 through 2000, an average of 8% of Americans named drugs as the most important problem facing the country. Since 2007, the average has been 1%.
The fall in concern about drugs may also reflect less-prominent federal anti-drug efforts in recent years than in the 1970s, 1980s and 1990s. In fact, more recently, much of the news about drug policy has focused on state-level efforts to decriminalize marijuana. Those efforts are consistent with shifts in public opinion, as Americans' support for legalizing marijuana has nearly doubled, from 31% in 2000 to 60% today.
Americans' perceptions of the drug problem in the U.S. may also have become more politicized over time. In 2000, Republicans (84%), Democrats (84%) and independents (79%) were about equally likely to describe the drug problem as "extremely" or "very serious." Today, there is a wide partisan gap, as 81% of Republicans and 57% of Democrats hold that view.
Republicans may view the U.S. drug situation more negatively because a Democratic president is in office. When George W. Bush was president in 2007, Republicans (69%) were less likely than Democrats (75%) to describe the U.S. drug problem as being serious. Republicans this year may also be responding to Donald Trump's making drug traffic from Mexico a campaign issue.
Aside from Republicans, every major subgroup in the U.S. is much less likely today than in 2000 to believe illegal drugs are an extremely or very serious problem in the country. Declines have been largest among Democrats, young adults and nonwhites, who now rank among the groups least likely to view the U.S. drug situation as this serious.
In fact, less than a majority of 18- to 29-year-olds, 45%, now hold this view -- compared with 71% in 2000. This drop could reflect a generational change, as today's young adults were between the ages of 2 and 13 in 2000, and are therefore likely unfamiliar with strong government anti-drug efforts of the past.
| 2000 | 2007 | 2016 | ||||||||||||||||||||||||||||||||||||||||||||||||||||||||||||||||||||||||||||||||||||||||||||||||||
|---|---|---|---|---|---|---|---|---|---|---|---|---|---|---|---|---|---|---|---|---|---|---|---|---|---|---|---|---|---|---|---|---|---|---|---|---|---|---|---|---|---|---|---|---|---|---|---|---|---|---|---|---|---|---|---|---|---|---|---|---|---|---|---|---|---|---|---|---|---|---|---|---|---|---|---|---|---|---|---|---|---|---|---|---|---|---|---|---|---|---|---|---|---|---|---|---|---|---|---|---|
| % | % | % | ||||||||||||||||||||||||||||||||||||||||||||||||||||||||||||||||||||||||||||||||||||||||||||||||||
| Gender | ||||||||||||||||||||||||||||||||||||||||||||||||||||||||||||||||||||||||||||||||||||||||||||||||||||
| Men | 77 | 66 | 59 | |||||||||||||||||||||||||||||||||||||||||||||||||||||||||||||||||||||||||||||||||||||||||||||||||
| Women | 86 | 80 | 70 | |||||||||||||||||||||||||||||||||||||||||||||||||||||||||||||||||||||||||||||||||||||||||||||||||
| Age | ||||||||||||||||||||||||||||||||||||||||||||||||||||||||||||||||||||||||||||||||||||||||||||||||||||
| 18 to 29 years | 71 | 71 | 45 | |||||||||||||||||||||||||||||||||||||||||||||||||||||||||||||||||||||||||||||||||||||||||||||||||
| 30 to 49 years | 80 | 63 | 63 | |||||||||||||||||||||||||||||||||||||||||||||||||||||||||||||||||||||||||||||||||||||||||||||||||
| 50 to 64 years | 88 | 77 | 72 | |||||||||||||||||||||||||||||||||||||||||||||||||||||||||||||||||||||||||||||||||||||||||||||||||
| 65+ years | 91 | 89 | 77 | |||||||||||||||||||||||||||||||||||||||||||||||||||||||||||||||||||||||||||||||||||||||||||||||||
| Race | ||||||||||||||||||||||||||||||||||||||||||||||||||||||||||||||||||||||||||||||||||||||||||||||||||||
| White | 80 | 71 | 69 | |||||||||||||||||||||||||||||||||||||||||||||||||||||||||||||||||||||||||||||||||||||||||||||||||
| Nonwhite | 90 | 80 | 57 | |||||||||||||||||||||||||||||||||||||||||||||||||||||||||||||||||||||||||||||||||||||||||||||||||
| Party identification | ||||||||||||||||||||||||||||||||||||||||||||||||||||||||||||||||||||||||||||||||||||||||||||||||||||
| Republican | 84 | 69 | 81 | |||||||||||||||||||||||||||||||||||||||||||||||||||||||||||||||||||||||||||||||||||||||||||||||||
| Independent | 79 | 74 | 58 | |||||||||||||||||||||||||||||||||||||||||||||||||||||||||||||||||||||||||||||||||||||||||||||||||
| Democrat | 84 | 75 | 57 | |||||||||||||||||||||||||||||||||||||||||||||||||||||||||||||||||||||||||||||||||||||||||||||||||
| Church attendance | ||||||||||||||||||||||||||||||||||||||||||||||||||||||||||||||||||||||||||||||||||||||||||||||||||||
| Weekly | 91 | 82 | 76 | |||||||||||||||||||||||||||||||||||||||||||||||||||||||||||||||||||||||||||||||||||||||||||||||||
| Monthly | 82 | 73 | 68 | |||||||||||||||||||||||||||||||||||||||||||||||||||||||||||||||||||||||||||||||||||||||||||||||||
| Seldom/Never | 76 | 68 | 59 | |||||||||||||||||||||||||||||||||||||||||||||||||||||||||||||||||||||||||||||||||||||||||||||||||
| Education | ||||||||||||||||||||||||||||||||||||||||||||||||||||||||||||||||||||||||||||||||||||||||||||||||||||
| College graduate | 74 | 65 | 59 | |||||||||||||||||||||||||||||||||||||||||||||||||||||||||||||||||||||||||||||||||||||||||||||||||
| College nongraduate | 85 | 77 | 67 | |||||||||||||||||||||||||||||||||||||||||||||||||||||||||||||||||||||||||||||||||||||||||||||||||
| Household income | ||||||||||||||||||||||||||||||||||||||||||||||||||||||||||||||||||||||||||||||||||||||||||||||||||||
| Less than $30,000 | 86 | 83 | 68 | |||||||||||||||||||||||||||||||||||||||||||||||||||||||||||||||||||||||||||||||||||||||||||||||||
| $30,000 to $74,999 | 82 | 76 | 66 | |||||||||||||||||||||||||||||||||||||||||||||||||||||||||||||||||||||||||||||||||||||||||||||||||
| $75,000+ | 73 | 59 | 60 | |||||||||||||||||||||||||||||||||||||||||||||||||||||||||||||||||||||||||||||||||||||||||||||||||
| Place of residence | ||||||||||||||||||||||||||||||||||||||||||||||||||||||||||||||||||||||||||||||||||||||||||||||||||||
| Big/Small city | 82 | n/a | 62 | |||||||||||||||||||||||||||||||||||||||||||||||||||||||||||||||||||||||||||||||||||||||||||||||||
| Suburb | 78 | n/a | 59 | |||||||||||||||||||||||||||||||||||||||||||||||||||||||||||||||||||||||||||||||||||||||||||||||||
| Town/Rural area | 72 | n/a | 73 | |||||||||||||||||||||||||||||||||||||||||||||||||||||||||||||||||||||||||||||||||||||||||||||||||
| n/a = not available | ||||||||||||||||||||||||||||||||||||||||||||||||||||||||||||||||||||||||||||||||||||||||||||||||||||
| Gallup Crime Polls | ||||||||||||||||||||||||||||||||||||||||||||||||||||||||||||||||||||||||||||||||||||||||||||||||||||
One in Three Say Drugs Are Serious Problem in Local Area
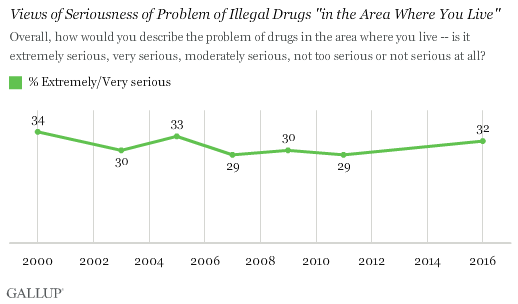
Americans express far less concern about drugs being a problem in their local area. The poll finds 32% of Americans describing drugs as an extremely or very serious problem in the area where they live. That is consistent with what Gallup has measured on six other occasions since 2000, with the percentage typically near 30%.

In addition to the 32% who currently describe drugs as an extremely or very serious problem in their local area, 35% say it is a "moderately serious problem," and 31% say it is "not too serious" or "not serious at all."
Americans' more positive assessments of the drug situation in their local area than nationally are consistent with their tendency to rate their own situation much better than the situation in the rest of the country. This includes assessments of crime, education, healthcare, and their overall satisfaction.
Americans who describe their local area as suburban (22%) are much less likely than those who say they live in a city (33%) or a town or rural area (39%) to rate drugs as an extremely or very serious problem in their area.
Implications
A majority of Americans continue to believe drugs are a serious problem in the U.S., but the percentage has fallen significantly since 2000. The continuing high concern about drugs probably reflects Americans' recognition that drugs can harm people, but the decline in the level of concern might reflect reduced news media and government focus on drugs as a problem. Both presidential candidates have raised the drug issue during the campaign, although it has not received nearly as much attention as other issues such as immigration and trade, or character concerns about the candidates.
Younger adults, who have never known a time when drugs were among the most prominent issues on the national landscape, show far less concern about drugs than older adults do. They have also come of age at a time when Americans, particularly those in their age cohort, support legalizing marijuana. Given the differences by age in concern about the drug problem, the trend toward lesser concern about drugs could continue in the decades to come.
Historical data are available in Gallup Analytics.
Survey Methods
Results for this Gallup poll are based on telephone interviews conducted Oct. 5-9, 2016, with a random sample of 1,017 adults, aged 18 and older, living in all 50 U.S. states and the District of Columbia. For results based on the total sample of national adults, the margin of sampling error is ±4 percentage points at the 95% confidence level. All reported margins of sampling error include computed design effects for weighting.
Each sample of national adults includes a minimum quota of 60% cellphone respondents and 40% landline respondents, with additional minimum quotas by time zone within region. Landline and cellular telephone numbers are selected using random-digit-dial methods.
View survey methodology, complete question responses and trends.
Learn more about how the Gallup Poll Social Series works.


