Story Highlights
- Hawaii has highest well-being scores in three of five well-being elements
- Alaska among top two well-being states for third straight year
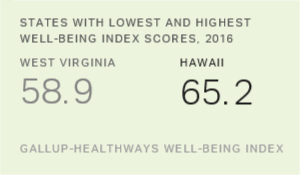
- West Virginia is lowest well-being state for eighth straight year
WASHINGTON, D.C. -- Hawaii residents had the highest well-being in the nation in 2016, with the state reaching the top spot for the sixth time since Gallup and Healthways began tracking well-being in 2008. Alaska finished in the top two for the third consecutive year, while Colorado finished in the top 10 for the ninth straight year and joins Hawaii as the only two states to earn this distinction.
| State | Well-Being Index Score | ||||||||||||||||||||||||||||||||||||||||||||||||||||||||||||||||||||||||||||||||||||||||||||||||||
|---|---|---|---|---|---|---|---|---|---|---|---|---|---|---|---|---|---|---|---|---|---|---|---|---|---|---|---|---|---|---|---|---|---|---|---|---|---|---|---|---|---|---|---|---|---|---|---|---|---|---|---|---|---|---|---|---|---|---|---|---|---|---|---|---|---|---|---|---|---|---|---|---|---|---|---|---|---|---|---|---|---|---|---|---|---|---|---|---|---|---|---|---|---|---|---|---|---|---|---|
| Hawaii | 65.2 | ||||||||||||||||||||||||||||||||||||||||||||||||||||||||||||||||||||||||||||||||||||||||||||||||||
| Alaska | 64.0 | ||||||||||||||||||||||||||||||||||||||||||||||||||||||||||||||||||||||||||||||||||||||||||||||||||
| South Dakota | 63.7 | ||||||||||||||||||||||||||||||||||||||||||||||||||||||||||||||||||||||||||||||||||||||||||||||||||
| Maine | 63.6 | ||||||||||||||||||||||||||||||||||||||||||||||||||||||||||||||||||||||||||||||||||||||||||||||||||
| Colorado | 63.5 | ||||||||||||||||||||||||||||||||||||||||||||||||||||||||||||||||||||||||||||||||||||||||||||||||||
| Vermont | 63.5 | ||||||||||||||||||||||||||||||||||||||||||||||||||||||||||||||||||||||||||||||||||||||||||||||||||
| Arizona | 63.4 | ||||||||||||||||||||||||||||||||||||||||||||||||||||||||||||||||||||||||||||||||||||||||||||||||||
| Montana | 63.2 | ||||||||||||||||||||||||||||||||||||||||||||||||||||||||||||||||||||||||||||||||||||||||||||||||||
| Minnesota | 63.2 | ||||||||||||||||||||||||||||||||||||||||||||||||||||||||||||||||||||||||||||||||||||||||||||||||||
| Texas | 63.1 | ||||||||||||||||||||||||||||||||||||||||||||||||||||||||||||||||||||||||||||||||||||||||||||||||||
| Gallup-Healthways Well-Being Index | |||||||||||||||||||||||||||||||||||||||||||||||||||||||||||||||||||||||||||||||||||||||||||||||||||
West Virginia and Kentucky residents have the lowest and second-lowest well-being, respectively, for the eighth year in a row. Ohio, Arkansas and Mississippi join West Virginia and Kentucky as the five states that have placed in the bottom 10 in all nine years of tracking. Alabama and Louisiana have appeared in the bottom 10 seven times, while Oklahoma and Indiana are in the bottom 10 for the fourth time in the last five years. Rhode Island, usually somewhat higher, appears in the bottom 10 for the first time.
| State | Well-Being Index Score | ||||||||||||||||||||||||||||||||||||||||||||||||||||||||||||||||||||||||||||||||||||||||||||||||||
|---|---|---|---|---|---|---|---|---|---|---|---|---|---|---|---|---|---|---|---|---|---|---|---|---|---|---|---|---|---|---|---|---|---|---|---|---|---|---|---|---|---|---|---|---|---|---|---|---|---|---|---|---|---|---|---|---|---|---|---|---|---|---|---|---|---|---|---|---|---|---|---|---|---|---|---|---|---|---|---|---|---|---|---|---|---|---|---|---|---|---|---|---|---|---|---|---|---|---|---|
| West Virginia | 58.9 | ||||||||||||||||||||||||||||||||||||||||||||||||||||||||||||||||||||||||||||||||||||||||||||||||||
| Kentucky | 60.5 | ||||||||||||||||||||||||||||||||||||||||||||||||||||||||||||||||||||||||||||||||||||||||||||||||||
| Oklahoma | 60.5 | ||||||||||||||||||||||||||||||||||||||||||||||||||||||||||||||||||||||||||||||||||||||||||||||||||
| Indiana | 60.5 | ||||||||||||||||||||||||||||||||||||||||||||||||||||||||||||||||||||||||||||||||||||||||||||||||||
| Arkansas | 60.8 | ||||||||||||||||||||||||||||||||||||||||||||||||||||||||||||||||||||||||||||||||||||||||||||||||||
| Ohio | 60.9 | ||||||||||||||||||||||||||||||||||||||||||||||||||||||||||||||||||||||||||||||||||||||||||||||||||
| Alabama | 61.0 | ||||||||||||||||||||||||||||||||||||||||||||||||||||||||||||||||||||||||||||||||||||||||||||||||||
| Louisiana | 61.0 | ||||||||||||||||||||||||||||||||||||||||||||||||||||||||||||||||||||||||||||||||||||||||||||||||||
| Rhode Island | 61.3 | ||||||||||||||||||||||||||||||||||||||||||||||||||||||||||||||||||||||||||||||||||||||||||||||||||
| Mississippi | 61.3 | ||||||||||||||||||||||||||||||||||||||||||||||||||||||||||||||||||||||||||||||||||||||||||||||||||
| Gallup-Healthways Well-Being Index | |||||||||||||||||||||||||||||||||||||||||||||||||||||||||||||||||||||||||||||||||||||||||||||||||||
These state-level data are based on more than 177,000 interviews with U.S. adults across all 50 states, conducted from January to December 2016. The Well-Being Index is calculated on a scale of 0 to 100, where 0 represents the lowest possible well-being and 100 represents the highest possible well-being. In most cases, a difference of 0.5 to 1.0 points in the Well-Being Index score between any two states represents a statistically significant gap.
For the nation overall, the Well-Being Index score was 62.1 in 2016, a statistically meaningful improvement from the 61.7 and the 61.6 measured in 2015 and 2014, respectively.
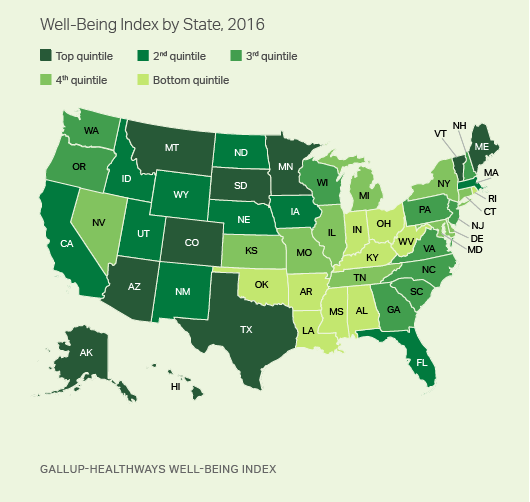
As in prior years, well-being follows a regional pattern. Outside of Hawaii and Alaska, the states with the highest well-being are located in the Northern Plains and the Mountain West, in addition to pockets of the Northeast and Southwest. The states with the lowest well-being are found in the South and the industrial Midwest.
Florida bucks the low well-being trend in the South, ranking among the top 12 states in well-being for the second year in a row. Meanwhile, Nevada has lower well-being (33rd highest) than other states in the West.
Alaska Has Best Social Well-Being Score; Texas Highest in Purpose
The Gallup-Healthways Well-Being Index comprises questions measuring five specific elements of well-being:
- Purpose: liking what you do each day and being motivated to achieve your goals
- Social: having supportive relationships and love in your life
- Financial: managing your economic life to reduce stress and increase security
- Community: liking where you live, feeling safe and having pride in your community
- Physical: having good health and enough energy to get things done daily
Hawaii residents lead the nation in the financial, community and physical elements, while Alaska leads in social well-being and Texas leads in purpose well-being. Arizona is among the top three states in social and purpose well-being.
West Virginians have the lowest well-being in three of the five elements: physical, financial and purpose. Rhode Island has the lowest well-being in the remaining two elements: community and social well-being.
In addition to West Virginia and Rhode Island, Oklahoma ranks among the bottom five states in three elements of well-being, and Arkansas, Indiana and Alabama do so for two elements each.

Implications
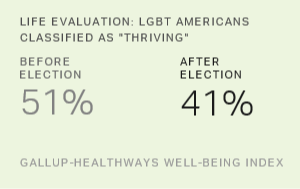
Nationally, many aspects of well-being improved last year to their best levels since Gallup-Healthways measurement began in 2008. For example, the percentage of Americans rating their lives well enough to be classified as "thriving" reached a record high of 55.4% in 2016. The percentage of Americans without health insurance fell to 10.9%, its lowest measured level. The adult smoking rate dropped to 18.0%, down from 21.1% at the onset of the Well-Being Index in 2008. And the Gallup Standard of Living Index reached a high of +50.
But not all trends have been positive. Americans' assessments of their own health have worsened, while the percentages of adults who are obese or who have been diagnosed with diabetes are at new highs. The percentage of Americans who have been diagnosed with depression, too, has reached its highest level in 2016.
Improvements in well-being at the national level are driven by improvements at the state and local levels. Hawaii, Alaska, South Dakota, Colorado, Montana and Minnesota have consistently been among the highest well-being states and thus set a standard for the rest of the states to follow. Other states like California, Texas and Florida have had much stronger showings in the last few years, demonstrating that improvement over time is possible.
States and local communities can focus on the five elements of well-being when designing and implementing initiatives to improve residents' overall well-being. For example, leaders in California, Oregon, Iowa, Texas, Florida and Hawaii have launched Blue Zones Project Initiatives designed to improve many key aspects of well-being. These initiatives include working with restaurants and grocery stores to make it easier for residents to select healthy choices.
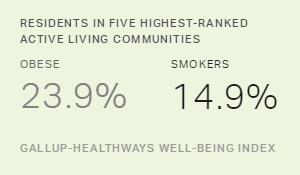
Leaders can also commit to investing in building infrastructure that promotes active living in their communities. Gallup and Healthways research shows that communities that invest in active living initiatives have healthier residents. These types of interventions can help individuals in their pursuit of a life well-lived.
These data are available in Gallup Analytics.
Read more about national and state well-being trends in the 2016 State of American Well-Being report.
Survey Methods
Results are based on telephone interviews conducted Jan. 2-Dec. 30, 2016, as a part of the Gallup-Healthways Well-Being Index, with a random sample of 177,192 adults, aged 18 and older, living in all 50 U.S. states and the District of Columbia. For results based on the total sample of national adults, the margin of sampling error for the Well-Being Index score is ±0.1 points at the 95% confidence level. The margin of sampling error for most states is about ±0.6 points, although this increases to about ±1.6 points for the smallest population states such as North Dakota, Wyoming, Hawaii and Delaware. All reported margins of sampling error include computed design effects for weighting.
Each sample of national adults includes a minimum quota of 60% cellphone respondents and 40% landline respondents, with additional minimum quotas by time zone within region. Landline and cellular telephone numbers are selected using random-digit-dial methods.
Learn more about how the Gallup-Healthways Well-Being Index works.