Story Highlights
- Gallup's U.S. Economic Confidence Index at +7 last week
- Index has been positive for 14 weeks straight
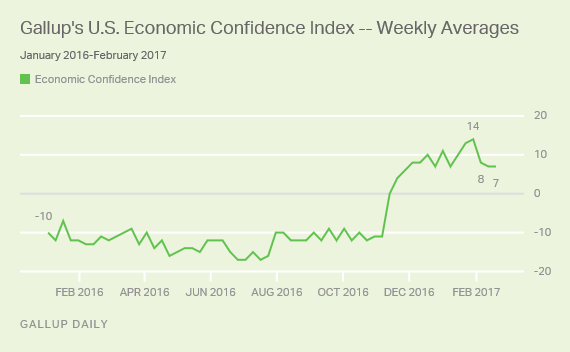
WASHINGTON, D.C. -- Americans remain slightly more optimistic than pessimistic about the state of the economy. Gallup's U.S. Economic Confidence Index averaged +7 for the week ending Feb. 19, unchanged from the prior week. This is the 14th week in a row that the index has been positive.

Americans' views of the economy have improved significantly since the U.S. presidential election. In nearly nine years -- from when Gallup began tracking economic confidence daily in January 2008 to the November 2016 presidential election -- Gallup's U.S. Economic Confidence Index was positive in only nine weeks, all of which occurred in late 2014 or early 2015.
While the index generally improved between Donald Trump's election and his first full week in office, it has receded since. It dropped from a nine-year high of +14 for the week ending Jan. 29 to +8 the following week and has yet to bounce back.
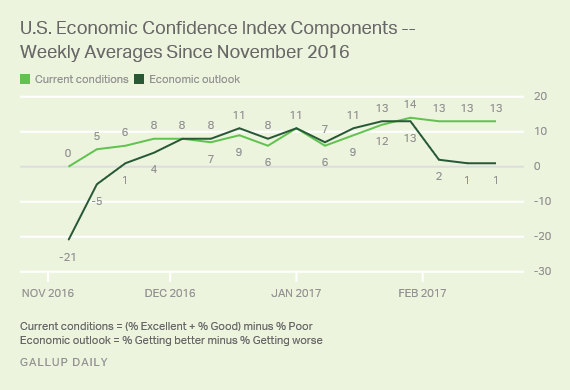
Gallup's U.S. Economic Confidence Index is the average of two components: how Americans rate current economic conditions and whether they feel the economy is improving or getting worse. The index has a theoretical maximum of +100 if all Americans were to say the economy is doing well and improving, and a theoretical minimum of -100 if all Americans were to say the economy is doing poorly and getting worse.
Last week, the current conditions component of the index stood at +13, based on 33% of Americans rating the current economic conditions of the country as "excellent" or "good," and 20% rating conditions as "poor." This is similar to the week before, when 32% said conditions were excellent or good and 19% said they were poor.
Meanwhile, the economic outlook score for last week was +1, unchanged from the prior week. But relative to Trump's first full week in office, fewer Americans believe the economy is "getting better." While slightly less than half believed this last week (47%), a clear majority believed this (53%) three weeks ago. A previous Gallup analysis has shown that the drop in the percentage of Americans who believe the economy is getting better is primarily attributable to worsening attitudes among Democrats.

Bottom Line
For 14 straight weeks, more Americans have been optimistic than pessimistic about the economy -- no mean achievement, given that for much of the last nine years, economic pessimism has been the more common perspective. It is difficult not to attribute this burst in economic positivity at least in part to the election of Trump -- in particular, the percentage of Americans who believed economic conditions are "getting better" climbed notably from his electoral victory to his inauguration.
But four weeks into Trump's presidency, there is some evidence that economic confidence has stalled -- the metric fell six points for the week ending Feb. 5 and has remained at that level since. Whether the index will regain its upward momentum or fall further down could be determined by many factors, including Trump's and the Republican Congress' ambitious but, so far, stalled economic agenda.
These data are available in Gallup Analytics.
Gallup.com reports results from these indexes in daily, weekly, and monthly averages and in Gallup.com stories. Complete trend data are always available to view in the following charts:
Daily: Employment, Economic Confidence, Job Creation, Consumer Spending
Weekly: Employment, Economic Confidence, Job Creation, Consumer Spending
Read more about Gallup's economic measures.
View our economic release schedule.
Survey Methods
Results for this Gallup poll are based on telephone interviews conducted Feb. 13-19, 2017, on the Gallup U.S. Daily survey, with a random sample of 3,539 adults, aged 18 and older, living in all 50 U.S. states and the District of Columbia. For results based on the total sample of national adults, the margin of sampling error is ±2 percentage points at the 95% confidence level. All reported margins of sampling error include computed design effects for weighting.
Each sample of national adults includes a minimum quota of 70% cellphone respondents and 30% landline respondents, with additional minimum quotas by time zone within region. Landline and cellular telephone numbers are selected using random-digit-dial methods.
Learn more about how the Gallup U.S. Daily works.


