Story Highlights
- U.S. Economic Confidence Index at +4 for week ending Nov. 19
- Index down from +7 one week earlier
- Current conditions component falls to +13 from +18
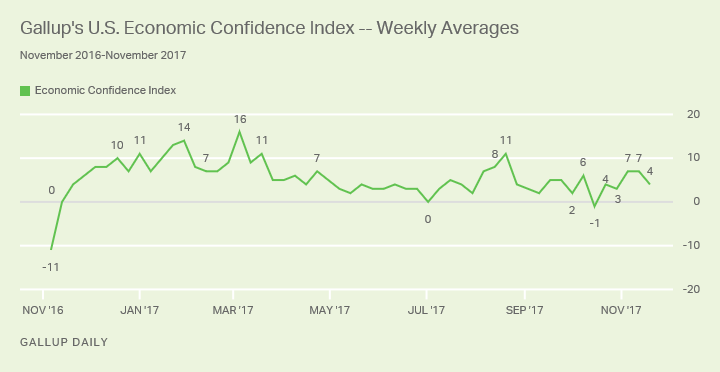
WASHINGTON, D.C. -- Americans felt slightly less confident in the economy last week, as their perceptions of current conditions dimmed somewhat. Gallup's U.S. Economic Confidence Index averaged +4 for the week ending Nov. 19, down from the previous reading of +7.

The modest fall in economic confidence last week snaps a two-week stretch of the index averaging +7, the highest score since August. Confidence is now closer to its average level so far this year (+5), meaning that the measure's decline last week represents a return to more typical levels.
Gallup's U.S. Economic Confidence Index is the average of two components: how Americans rate current economic conditions and whether they feel the economy is improving or getting worse. The index has a theoretical maximum of +100 if all Americans were to say the economy is doing well and improving, and a theoretical minimum of -100 if all were to say the economy is doing poorly and getting worse.
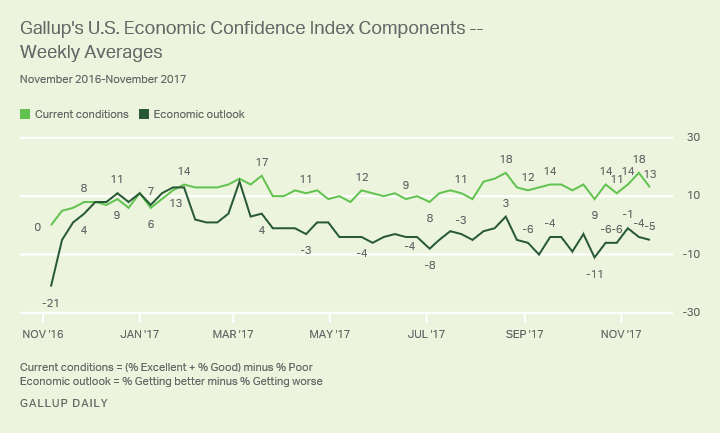
Driving down Americans' overall level of confidence last week was the small drop in perceptions of the economy's current economic conditions. The current conditions component averaged +13 for the week ending Nov. 19, with 35% of Americans describing the economy as "excellent" or "good" and 22% describing the economy as "poor." The latest current conditions score is down five points from the previous reading (+18), which was tied with the highest Gallup had measured since the recession. The current reading is in line with the component's average over the past 13 weeks.
Views on the direction of the economy, however, were steady last week, with the outlook component at -5, compared with the previous observation of -4. Last week, 45% of Americans said the economy was "getting better," while 50% said the economy was "getting worse."

Survey Methods
Results for this Gallup poll are based on telephone interviews conducted Nov. 13-19, 2017, on the Gallup U.S. Daily survey, with a random sample of 2,004 adults, aged 18 and older, living in all 50 U.S. states and the District of Columbia. For results based on the total sample of national adults, the margin of sampling error is ±3 percentage points at the 95% confidence level. All reported margins of sampling error include computed design effects for weighting.
Each sample of national adults includes a minimum quota of 70% cellphone respondents and 30% landline respondents, with additional minimum quotas by time zone within region. Landline and cellular telephone numbers are selected using random-digit-dial methods.
Learn more about how the Gallup U.S. Daily works.


