Story Highlights
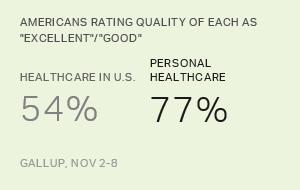
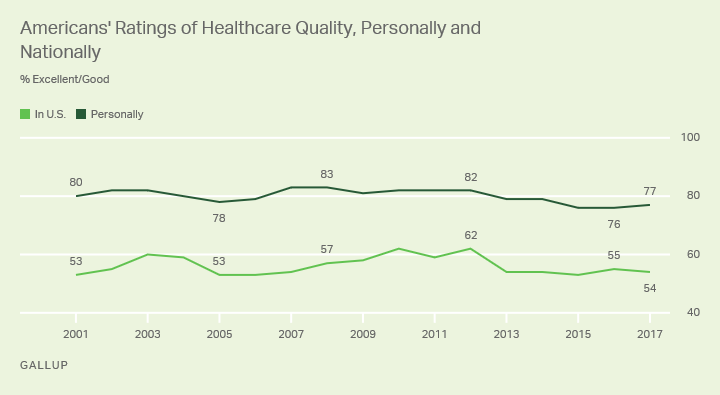
- 77% rate the quality of their own healthcare as "excellent" or "good"
- Ratings of personal coverage and cost have edged up since 2016
- Worst rating for national healthcare coverage since 2008
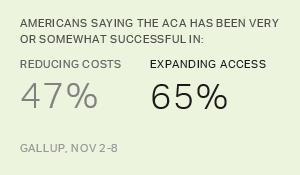
WASHINGTON, D.C. -- After multiple unsuccessful attempts by Republicans to dismantle the Affordable Care Act this year, Americans continue to be more positive about their own healthcare than the nation's healthcare as a whole when evaluating each on quality, coverage and cost.
Americans' ratings of the cost and coverage of their personal healthcare have become a bit more positive since last year. But their rating for national healthcare coverage is the lowest since 2008, before the passage of the ACA.
The public still rates the quality of both positively, although the rating Americans give to the quality of the personal care they receive is down slightly from where it was after the ACA passed in 2010.
The latest results are from Gallup's annual Health and Healthcare survey, conducted Nov. 2-8.
The 77% of U.S. adults who say the quality of their own healthcare is "excellent" or "good" is well above the 54% who say the same about healthcare quality in the U.S. overall. The average 24-percentage-point difference between the two measures since 2001 represents the smallest personal-national gap of the three dimensions of healthcare that Gallup tests.
Today's positive ratings of healthcare quality, both personally and nationally, are slightly below the historical highs. Eighty percent or more rated their personal healthcare as excellent or good from 2001 through 2004, and again from 2007 through 2012. Perceptions of healthcare quality in the U.S. rose to 62% after the passage of the Affordable Care Act in 2010 and matched that reading again in 2012.
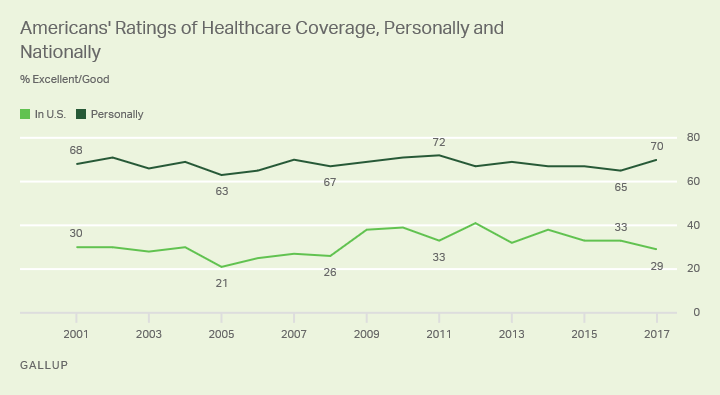
Majority Rates Personal Healthcare Coverage High, National Coverage Much Lower
Turning to their healthcare coverage, seven in 10 Americans rate their own coverage "excellent" or "good." Since last year, the percentage giving these responses has risen five points. Meanwhile, the 29% with a positive assessment of coverage nationally is down four points from last year and is the lowest it has been since 2008.
Majority Satisfied With Personal Healthcare Costs, but Not With National Costs
Gallup measures Americans' views of healthcare costs by asking if they are satisfied or dissatisfied with their own costs and with healthcare costs nationally. One in five (20%) are satisfied with the total cost of healthcare in the U.S. this year, consistent with most of the yearly readings since 2002. At the same time, three times as many, 61%, are satisfied with the total cost of their own healthcare. This represents a five-point uptick from last year but is largely consistent with the general trend since 2002.
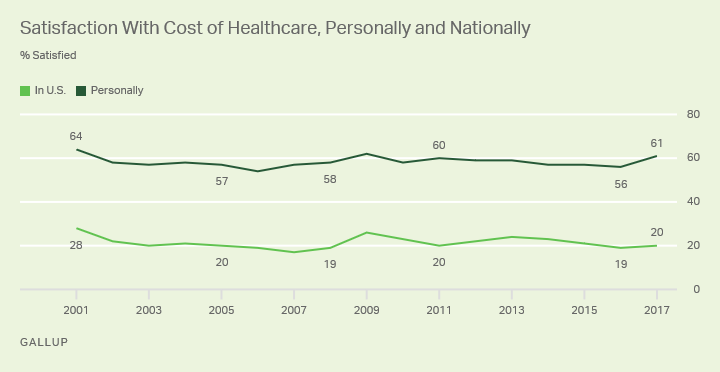
The highest satisfaction with personal and national healthcare costs was in 2001, at 64% and 28%, respectively.
Bottom Line
Since 2001, Gallup has found that Americans' assessments of their own healthcare -- its quality, coverage and costs -- are typically better than their assessments of healthcare in the country overall. This is consistent with a larger pattern found in Gallup research on such topics as crime, education and governance.
The Trump administration and congressional Republicans have thus far been unable to dismantle the ACA despite multiple attempts during the past year. Over that period, Americans' ratings of their personal coverage and cost have edged up, a finding that is contrary to Republican arguments for repeal of the law.
Survey Methods
Results for this Gallup poll are based on telephone interviews conducted Nov. 2-8, 2017, with a random sample of 1,028 adults, aged 18 and older, living in all 50 U.S. states and the District of Columbia. For results based on the total sample of national adults, the margin of sampling error is ±4 percentage points at the 95% confidence level. All reported margins of sampling error include computed design effects for weighting.
Each sample of national adults includes a minimum quota of 70% cellphone respondents and 30% landline respondents, with additional minimum quotas by time zone within region. Landline and cellular telephone numbers are selected using random-digit-dial methods.
View survey methodology, complete question responses and trends.
Learn more about how the Gallup Poll Social Series works.