Story Highlights
- Gallup's U.S. Economic Confidence Index averages +6 in 2017
- Current conditions component at +13 last year; economic outlook at -1
- Republicans' confidence in the economy rises 77 points to +46 in 2017
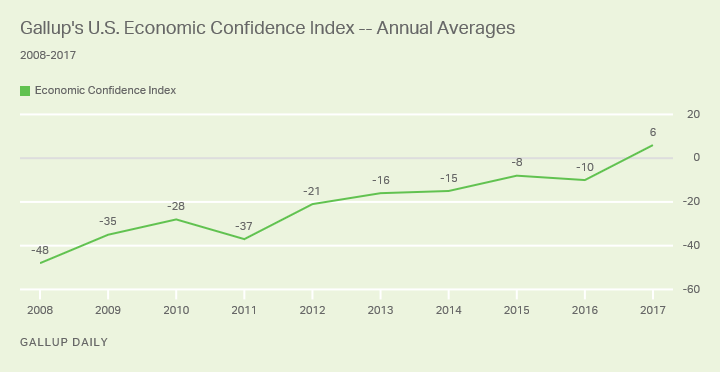
WASHINGTON, D.C. -- Americans' views of the U.S. economy were positive on balance in 2017, with Gallup's U.S. Economic Confidence Index averaging +6 for the year. This was a 16-point increase from -10 in 2016 and is the index's first positive annual average since Gallup began daily tracking of this measure in 2008.

Gallup's U.S. Economic Confidence Index is the average of two components: how Americans rate current economic conditions and whether they feel the economy is improving or getting worse. The index has a theoretical maximum of +100 if all Americans were to say the economy is doing well and improving, and a theoretical minimum of -100 if all were to say the economy is doing poorly and getting worse.
Overall, Americans' confidence in the economy has gradually if unevenly improved since the recession year of 2008, when economic confidence averaged -48. The index's weekly readings fell as low as -66 during that year.
Economic confidence increased slightly in 2009, the year the Great Recession officially ended, and further still in 2010, though sentiment remained decisively negative. However, confidence slipped again in 2011, as the specter of a possible U.S. default on its debt rattled Wall Street and Main Street alike. This effect was temporary, however, as confidence spiked by 16 points in 2012 -- tied with last year for the highest annual improvement in the trend -- though the index remained negative.
Confidence further strengthened over the next four years, although slowly, with the index's annual average increasing by a total of six points between 2013 and 2016. Confidence remained net-negative over this period, though the index's weekly measurements were positive for a brief time in early 2015 after gas prices plunged over several months in late 2014 and early 2015.
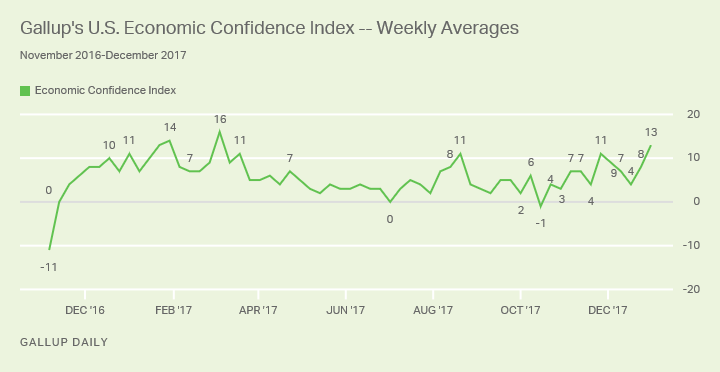
The election of Donald Trump in late 2016 helped push the index into positive territory on a consistent basis, as confidence dramatically improved after his election. The index's monthly average hit a then-record high of +9 in December 2016.
This newfound confidence carried over into 2017. The index averaged +10 or higher in eight separate weeks, including a score of +13 for the final week of the year. Often these peaks in confidence coincided with new highs hit by major stock indicators, especially the Dow Jones industrial average.

Republicans' Confidence in Economy Hits Nine-Year High
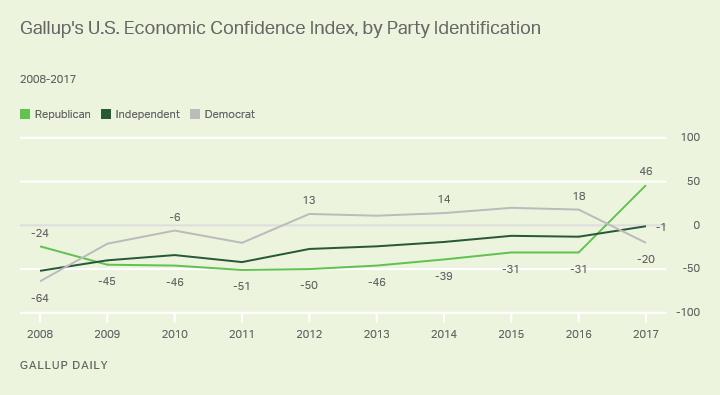
Republicans' confidence in the economy stood at +46 in 2017, a 77-point improvement from 2016 and the highest level for this group in Gallup's history of tracking this question. Undoubtedly, Republicans' economic optimism is partially based on the fact that the economy is now in the hands of a Republican president who made a number of conservative economic promises during the 2016 campaign and is working with a Republican-led Congress.
But partisanship doesn't completely explain improving economic perceptions -- economic confidence also rose among political independents in 2017, to -1 from -13 in 2016. And while Democrats' ratings of the economy deteriorated in 2017, this was less than the improvement in Republicans' confidence. In 2017, Democrats' economic confidence fell to -20 from +18 in 2016, a 38-point decline.

Americans More Confident in Current Conditions Than Economic Outlook
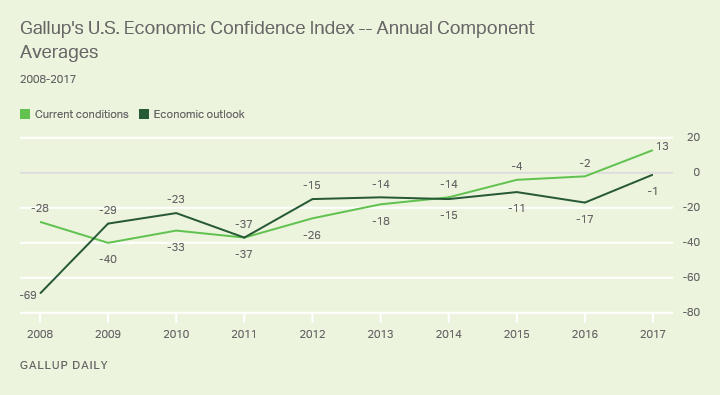
Perceptions of the economy's current conditions improved markedly in 2017, with more Americans rating them positively than negatively. The current conditions component of Gallup's U.S. Economic Confidence Index averaged +13 last year, up from -2 in 2016. Last year's score reflects the 34% of Americans who described the economy as "excellent" or "good," minus the 21% who described it as "poor."
The economic outlook component also advanced in 2017, though -- at -1 -- it remained slightly negative. This score is the result of 46% of Americans saying the economy was "getting better," while 47% said it was "getting worse." The outlook component averaged -17 in 2016.

Bottom Line
By a number of indicators, the U.S. economy had a good 2017. Closely followed stock market indexes such as the Dow performed strongly and set multiple new records over the course of the year, and the labor force unemployment rate fell to its lowest level in almost two decades. Crucially, national GDP grew at a quarterly rate of 3% or higher in the middle two quarters of 2017, only the third time the economy has grown this fast in consecutive quarters since before the recession.
Given these positive signs, it may be unsurprising that Americans regained their sense of economic confidence last year. But with economic pessimism dominating the national mood for so long, it was not necessarily foreordained that an improving economy would boost Americans' confidence. For instance, other key Gallup indicators, such as satisfaction with the way things are going in the U.S., have remained steadfastly low for about a decade despite changing national conditions.
Instead, economic confidence rallied in 2017. It is true that partisanship explains a portion of this rally: Republicans' surging confidence that began in late 2016 and continued last year was more the result of political, not economic, change. But at the same time, confidence has improved among independents, a sign that improving economic conditions are changing economic perceptions. Even Democrats in 2017 rated the economy's current conditions positively, though they were less sanguine about the economy's future -- presumably because they disagree with Trump's economic policies.
Moreover, a majority of Americans are optimistic about what the new year holds for the economy -- with 52% saying 2018 will be a year of economic prosperity. If that expectation becomes reality, Americans' confidence in the economy could continue to improve.
Survey Methods
Results for this Gallup poll are based on telephone interviews conducted Jan. 1-Dec. 31, 2017, on the Gallup U.S. Daily survey, with a random sample of 153,481 adults, aged 18 and older, living in all 50 U.S. states and the District of Columbia. For results based on the total sample of national adults, the margin of sampling error is ±1 percentage point at the 95% confidence level. All reported margins of sampling error include computed design effects for weighting.
Each sample of national adults includes a minimum quota of 70% cellphone respondents and 30% landline respondents, with additional minimum quotas by time zone within region. Landline and cellular telephone numbers are selected using random-digit-dial methods.
Learn more about how the Gallup U.S. Daily works.


